
FIGURE 2.
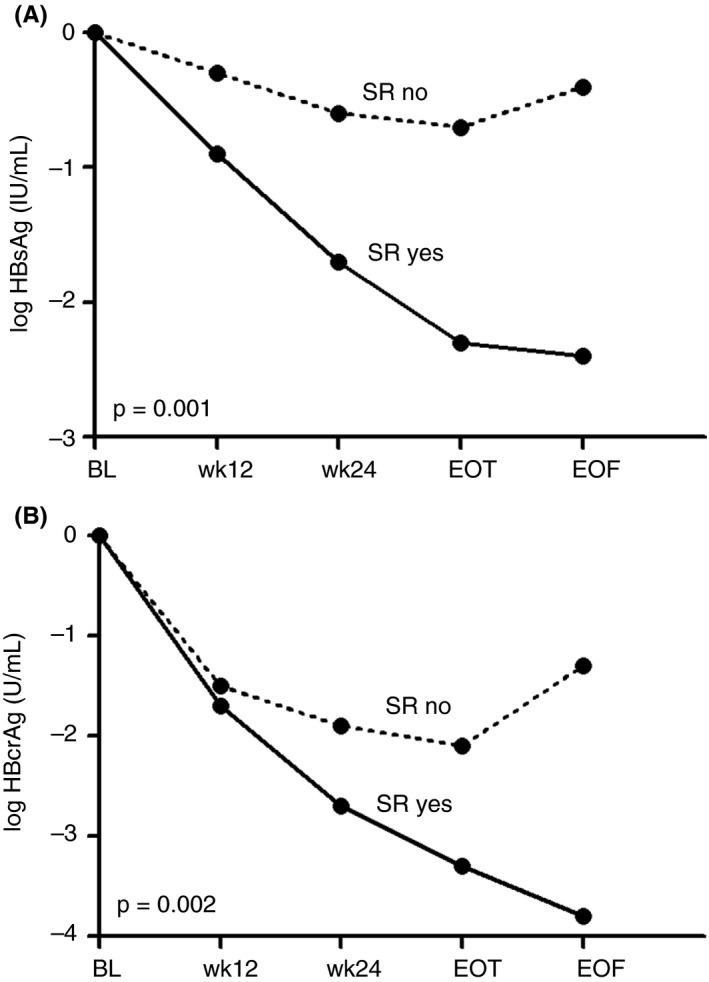
(A) Hepatitis B surface antigen (HBsAg) decline during treatment and follow‐up in patients with an hepatitis B virus (HBV) RNA response at on‐treatment week 24, stratified by patients with and without sustained response (HBV DNA <2000 IU/mL; SR). (B) Hepatitis B core‐related antigen (HBcrAg) decline during treatment and follow‐up in patients with an HBV RNA response at on‐treatment week 24, stratified by patients with and without SR. Assessed in patients with positive hepatitis B e antigen (HBeAg) at baseline. P‐value for comparison at week 24. BL, baseline; EOF, end of follow‐up; EOT, end of treatment; HBcrAg, hepatitis B core‐related antigen; HBsAg, hepatitis B surface antigen; SR, sustained response; wk, week