FIGURE 1.

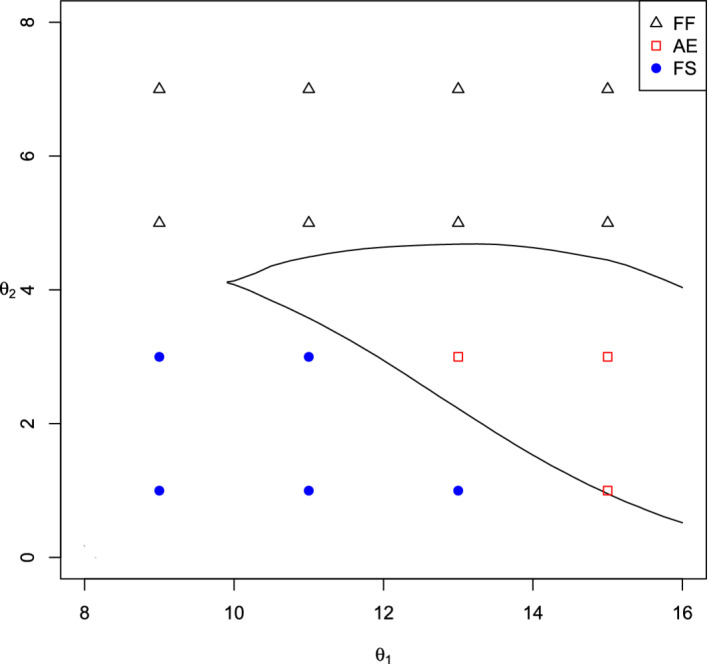
Regions of values in which each of the Fixed Full population (FF), Fixed Subpopulation (FS), and optimal Adaptive Enrichment (AE) designs give the highest value of [Color figure can be viewed at wileyonlinelibrary.com]

Regions of values in which each of the Fixed Full population (FF), Fixed Subpopulation (FS), and optimal Adaptive Enrichment (AE) designs give the highest value of [Color figure can be viewed at wileyonlinelibrary.com]