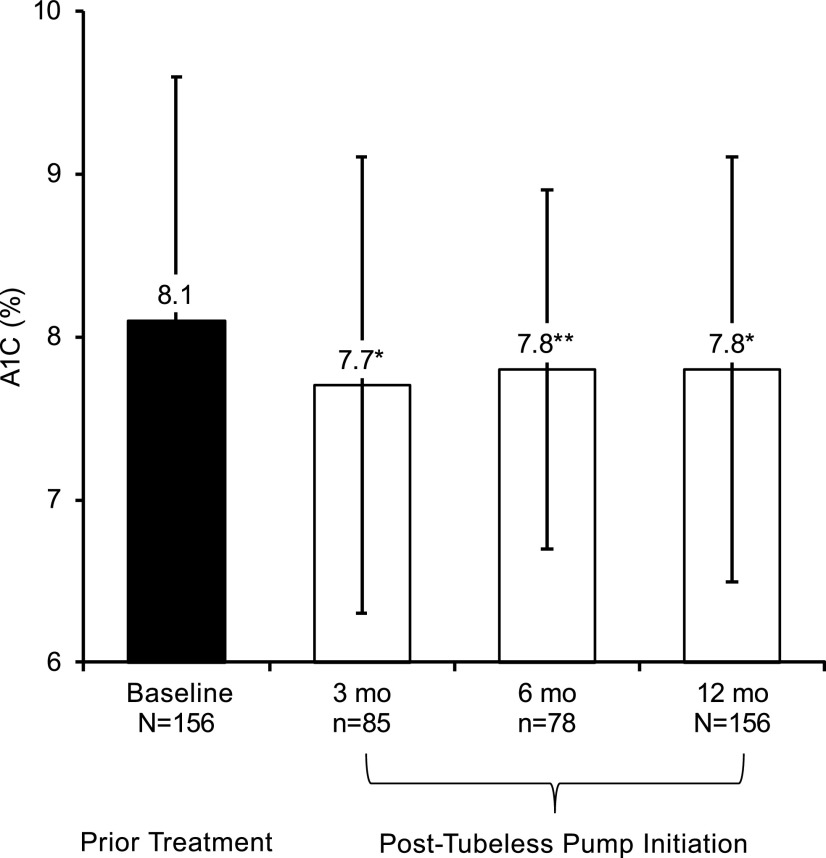
FIGURE 1.
A1C post-tubeless insulin pump initiation compared with prior treatment in the full cohort of 156 adults with type 1 diabetes. Mean A1C is plotted at baseline with prior treatment, as well as for the 3-, 6-, and 12-month follow-up time points after tubeless insulin pump initiation. A1C at baseline was 8.1 ± 1.6% for the subsample with data at the 3-month follow-up time point (n = 85) and 8.1 ± 1.4% for the subsample with data at the 6-month follow-up time point (n = 78) (not shown). The change from baseline at each point of follow-up was found to be significant by dependent t test for repeated measures (*P <0.01, **P = 0.02). The error bars indicate SD.

