
FIGURE 1.
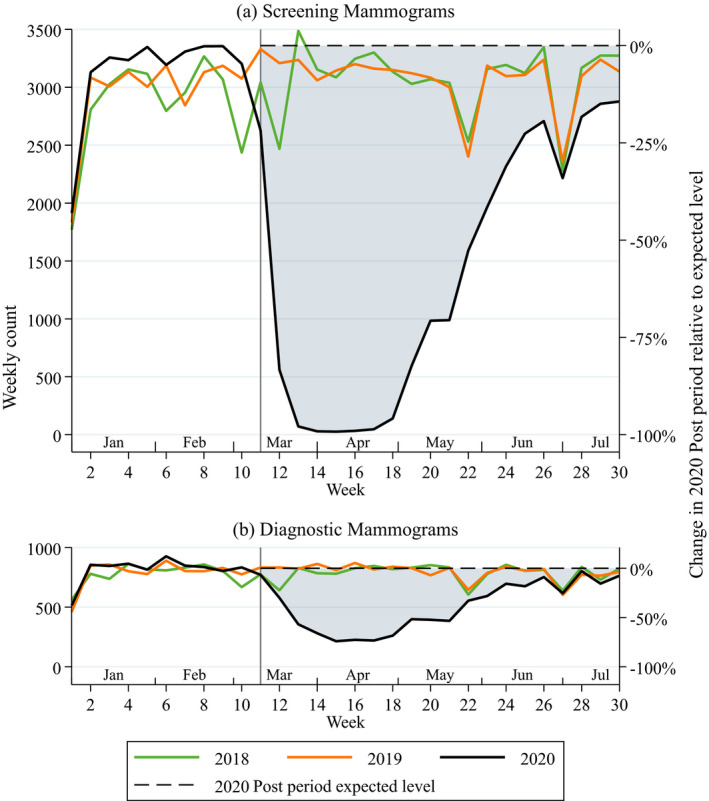
Trends in count of weekly mammograms in weeks 1 to 30 of the year. Notes. Based on claims posted as of August 31, 2020, for mammograms performed in the first 30 weeks of each year. Week 11 (vertical gray line) indicates the beginning of the post period. Dotted horizontal line shows the expected volume of mammograms that would have occurred during the post period in 2020 in the absence of the COVID‐19 pandemic. Shaded region captures missed mammograms during the post period in 2020. [Color figure can be viewed at wileyonlinelibrary.com]