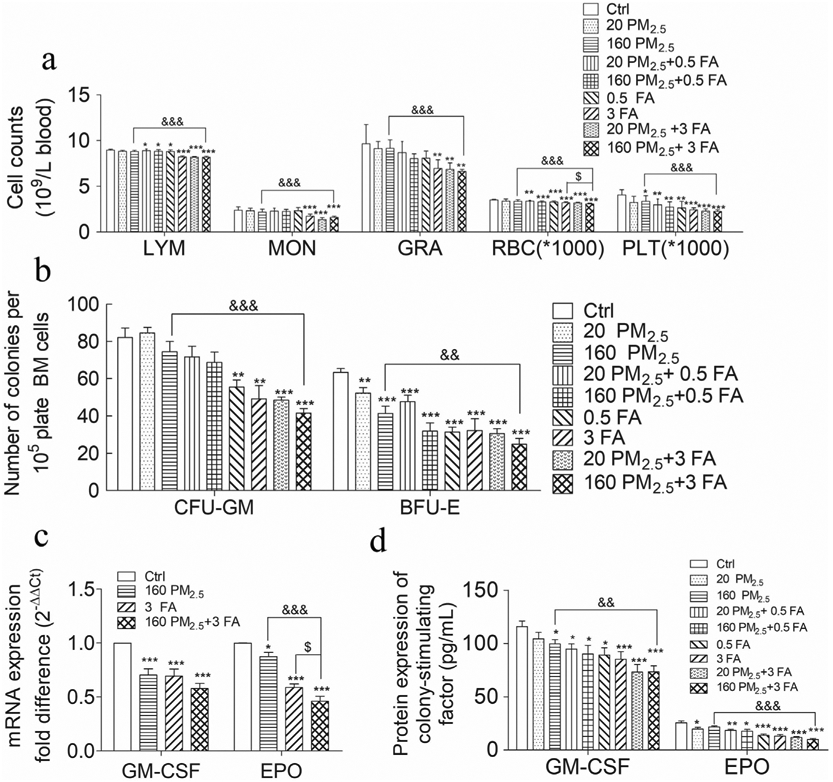
Fig. 2.

a Complete blood cell counts, lymphocytes (LYM), monocytes (MON), neutrophilic granulocytes (GRA), red blood cells (RBC) and platelets (PLT); b colony-forming unit–granulocyte-macrophages (CFU-GM) and burst-forming unit–erythroids (BFU-E) colonies forming from BM; c granulocyte–macrophage colony-stimulating factor (GM-CSF) and erythropoietin (EPO) mRNA expression in BM; d GM-CSF and EPO protein expression in BM. n = 6 for each group, * means p < 0.05, ** means p < 0.01, *** means p < 0.001, compared with the control group; & means p < 0.05, && means p < 0.01, &&& means p < 0.001, compared with the 160 PM2.5 group; $ means p < 0.05, $$ means p < 0.01, $$$ means p < 0.001, compared with the 3 FA group.
