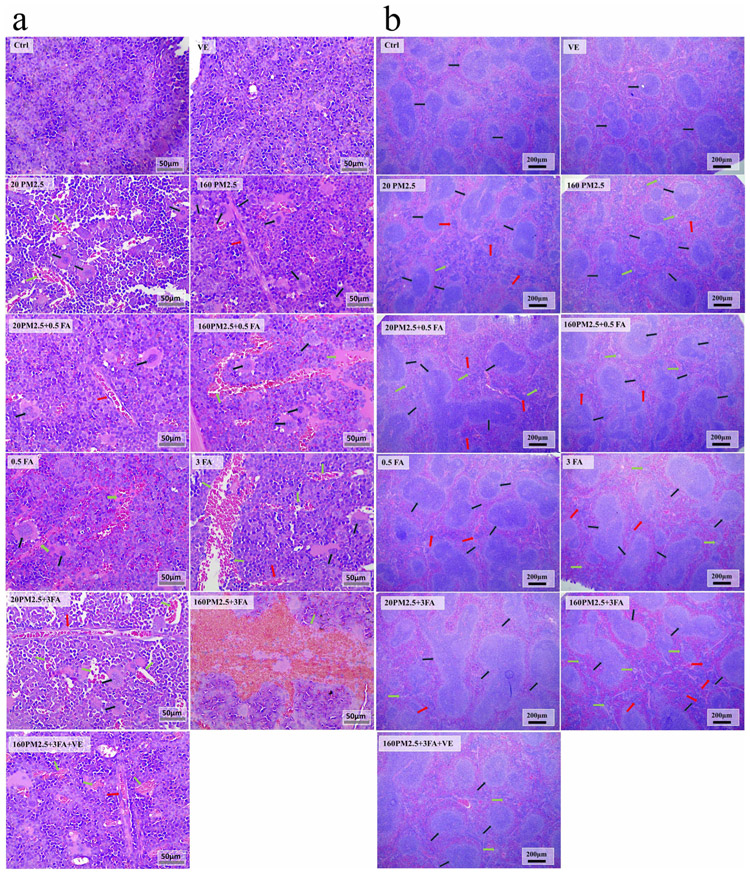
Fig. 3.
a Representative images (×400) of H&E stained mouse femurs after formaldehyde and/or PM2.5 exposure, n = 3 for each group. Red arrows: myelofibrosis, black arrows: megakaryocytes, green arrows: the cavity formed by the reduction of BM cells; b representative images (×400) of H&E stained mice spleen after formaldehyde and/or PM2.5 exposure. Red arrows: lymphoproliferation, green arrows: macrophages, black arrows: the germinal centre of splenic corpuscle.

