
Figure 2.
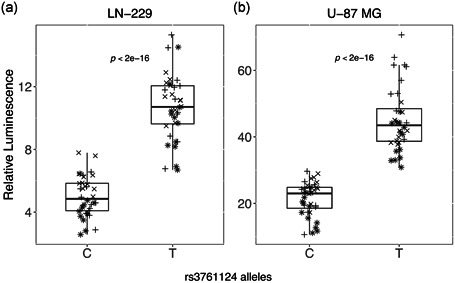
Allele‐specific enhancer activity of enhancer region 2. All enhancer regions seen in Figure 1 were cloned into a luciferase enhancer assay construct and tested for enhancer activity. Here, we show data for enhancer region 2 that includes SNP rs13761124 alleles T and C (four clones for each allele, three independent experiments for each cell line: (+) represents Experiment 1, (×) represents Experiment 2, and (*) represents Experiment 3. The construct with the T allele demonstrated statistically significantly higher activity than the C allele, as shown in box plots from LN‐229 (a) and U‐87 MG cells (b).p values represent the probability that the coefficient estimated for allele in the generalized estimating equation model used to test the effect of allele and experiment on relative luminescence would be observed if the true effect was zero. SNP, single‐nucleotide polymorphism