
Figure 5.
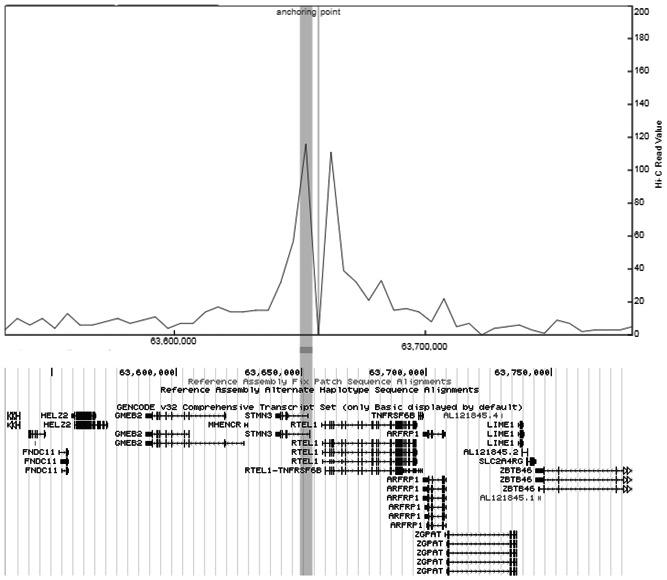
Visualization of chromosome interactions with rs3761124 in 20q13.33. Virtual 4C was constructed from Hi‐C data of the GBM cell line, G583. The anchoring point was the location of rs3761124 and also the bait region. Interactions of the bait with genomic regions were highlighted as peaks in the virtual 4C presentation. The horizontal bar shows the location of the promoter of STMN3 and corresponds to its interaction peak (contained within the vertical bar). Another interaction peak is observed near the promoter of RTEL1, which is transcribed in the opposite direction of STMN3,to the right of the anchoring point. GBM, glioblastoma multiforme