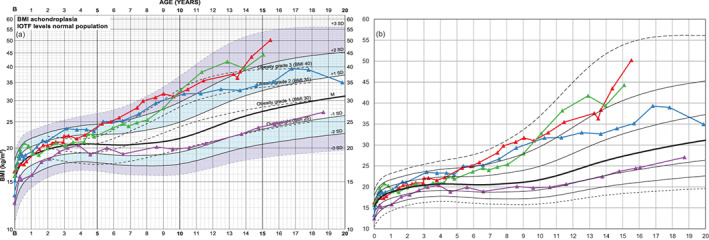
FIGURE 6.

BMI charts of four boys with achondroplasia: (a) the nonlinear BMI‐axis causes upper BMI “channels” to be increasingly compressed compared to a linear axis (b). Three boys (in blue, green, red) with pronounced ability to gain weight and one boy (in purple) with more healthy weight and thus BMI development are shown. The boy marked in red gains 13 kg within 14 months, 23 kg within 22 months, weight increasing from +2.1 to +2.8 SDS (not shown), which pushes BMI from +2.0 to +2.7 SDS at 15.5 years of age. During the same period, the boy marked in purple gains 9 kg, changing from −0.8 to −0.4 SDS in the weight chart (not shown) or −1.0 to −0.9 SDS in the BMI chart [Color figure can be viewed at wileyonlinelibrary.com]
