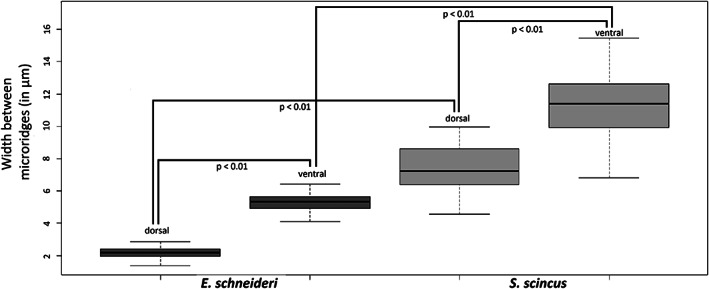
FIGURE 5.

Boxplots representing the inter microridge spaces (in μm) of the scales of Eumeces schneideri and Scincus scincus. The measurements were taken from 9 scales (30 microridge values per body region) selected at random from the ventral and dorsal regions of both species. Data were analyzed using the nonparametric Kruskal–Wallis test and significant differences were set at a p‐value <.01
