
Figure 2.
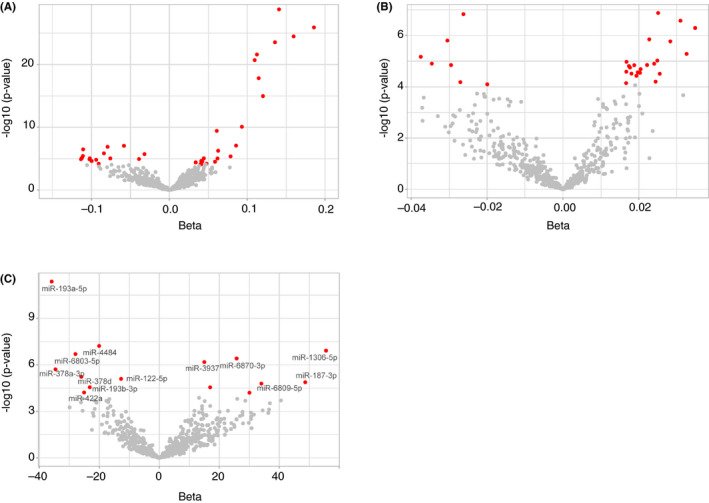
Volcano plots showing correlation between plasma levels of miRNAs and GGT (A), ALP (B), and continuous Hounsfield Unit values (C). The red dots indicate miRNAs significantly associated at Bonferroni‐corrected P < 8.46 × 10⁻⁵. The grey dots indicate miRNAs with no significant association. The name of miRNAs that were significantly associated with liver enzymes and the continuous Hounsfield Unit values are mentioned in (C). Abbreviations: ALP, Alkaline phosphatase; GGT, Gamma‐glutamyl transferase; miRNAs, microRNAs