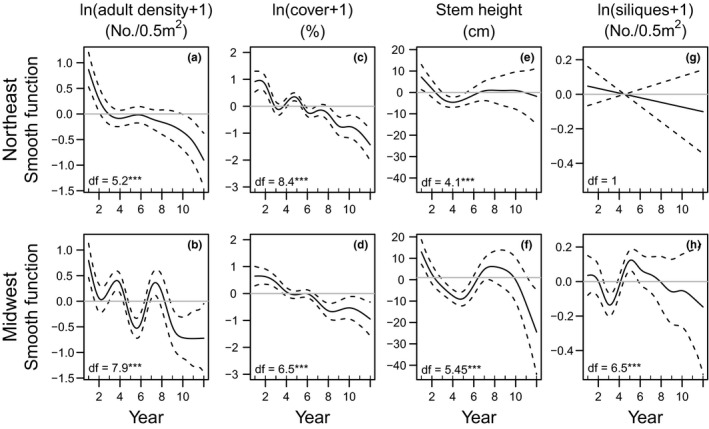
Figure 3.

Generalised Additive Mixed Model smooth curves (solid lines) with 95% credible intervals (dashed lines) for A. petiolata adult density (number/0.5 m2, log transformed, a and b), seedling and adult cover in June (%, log transformed, c and d), stem height (cm, e and f) and mean number of siliques per stem per quadrat (number/0.5 m2, log transformed, g and h) in Northeast regions (top panels, N = 7 sites) and Midwest regions (bottom panels N = 9 sites; see Table S1 for site designation). Locations with zero stem density were excluded from analyses of stem height and number of siliques. Models included random intercept effects for calendar year and nested effects for site and quadrat within site, as well as a random slope for monitoring year. Note different y‐axis scales for different performance measures. df = degrees of freedom; ***P < 0.001.
