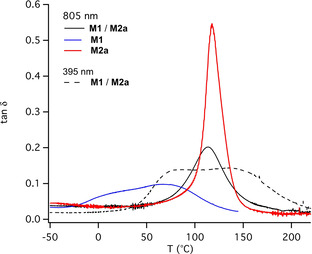
Figure 5.

DMA data (tanδ) of films (thickness: 120 μm) exposed at 395 nm (1.1 W cm−2) and 805 nm (1.2 W cm−2) in the case of the monomers M1 and M2 a after 2 min and 10 min exposure at 395 nm (1.1 W cm−2) and 805 nm (1.2 W cm−2), respectively. ITX (0.1 wt %) and 2 d (3.8×10⁻² mmol g−1) and the combination of 1 d (6.0×10⁻³ mmol g−1) and 2 d (3.8×10⁻² mmol g−1) served as initiator combination for experiments at 395 nm and 805 nm, respectively.
