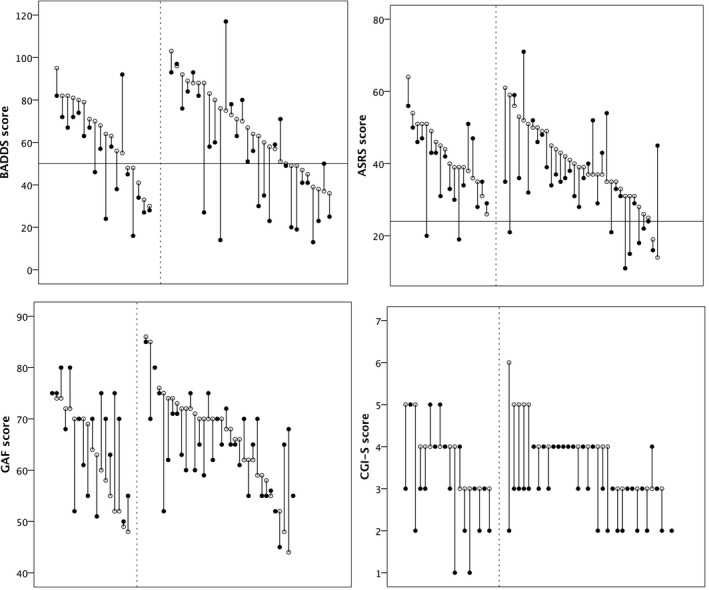
Fig. 1.

Drop‐line plots showing individual scores on BADDS, ASRS, CGI‐S and GAF at baseline (open circles) and at the 5‐year follow‐up (filled circles) in adult patients with ADHD. The horizontal lines denote clinical cut‐offs. Participants to the right of the vertical dotted line are patients receiving ADHD medication at both baseline and follow‐up; those to the left represent the rest.
