
Fig. 2.
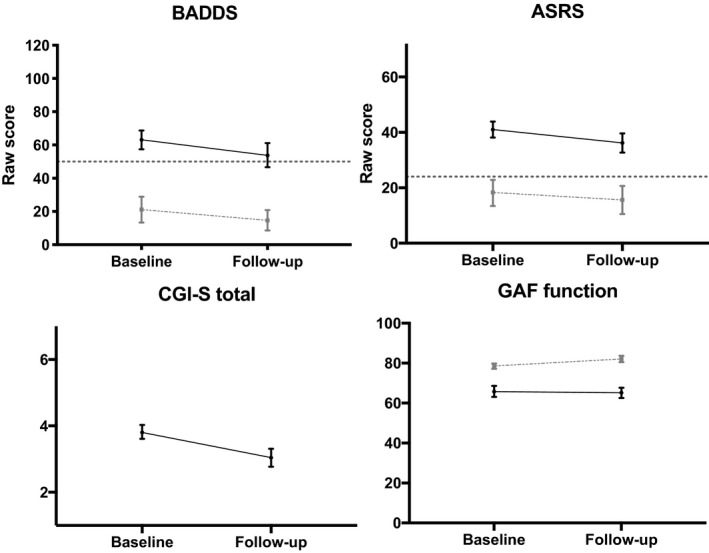
Self‐reported symptomatic changes, functional changes, and changes in clinicians’ ratings of symptoms, from baseline to 5‐year follow‐up. Black solid lines represent the patients; faded, dashed lines represent controls, and the dotted line marks clinical cut off. Means (M) and 95% Confidence Intervals (CIs) are presented. Note that the BADDS values for healthy controls are based on 10 respondents only.