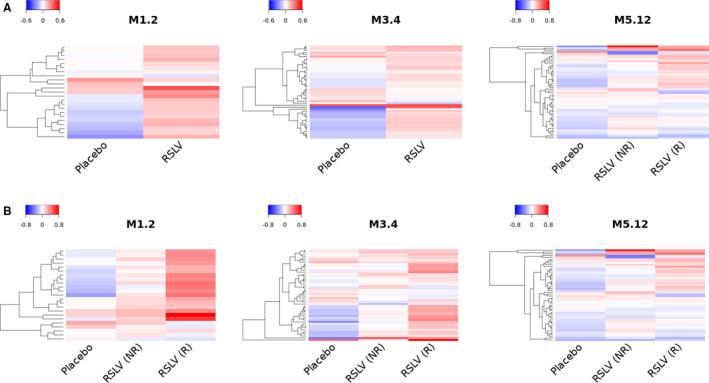
Figure 2.

Heatmaps showing changes in expression of interferon (IFN)–inducible genes from day 1 to day 99. The log2 fold change in expression of 3 modules (M1.2, M3.4, and M5.12) of IFN‐inducible genes was assessed in whole blood samples from the placebo group (n = 7) compared to the RSLV‐132 group as a whole (n = 20) (A) or the subgroups of RSLV‐132–treated patients who either achieved a clinical response (R) or did not achieve a clinical response (NR) (B) over the follow‐up.
