
Figure 3.
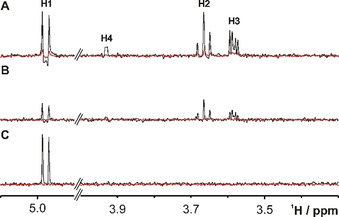
1D 1H traces from 2D 1H,77Se correlation spectra taken at the 77Se chemical shift (393.7 ppm) of SeDG (4 mm) in the absence (black) or presence (red) of hGal‐3 (0.125 mm). A) CPMG‐HSQMBC (Δ opt(H1)=70 ms, B CPMG=1143 Hz). The indirect H3 correlation signal (4 J H3,Se=0) derives from HoHaHa (TOCSY) transfer. B) HeHaHa (B DIPSI2=1450 Hz, Δ opt(H1)=80 ms). The average signal intensity is −60 % lower than in the HSQMBC spectrum. C) H1 selective HeHaHa (B DIPSI2=285 Hz, Δ opt(H1)=100 ms). The H1 signal now shows pure in‐phase splitting (3 J H1,H2=10 Hz) and 10 % (175 %) sensitivity gain relative to the corresponding CPMG‐HSQMBC (HeHaHa) spectrum. Corresponding 1H traces for the nonbinding SeDGlc are shown in Figure S4.