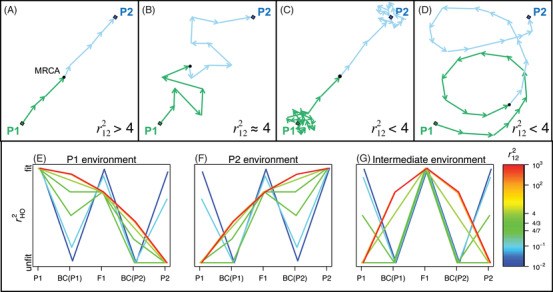
Figure 3.

(A)–(D) the distance can vary systematically with the mode of divergence between the parents. The variation depends on the chain of substitutions that differentiate the parental lines, and compares their trajectory to a random walk with the same number of steps, and distribution of effect sizes. (A) When substitutions form a more‐or‐less direct path between the parental phenotypes, the observed phenotypic difference is greater than would be predicted under a comparable random walk; this implies that with a maximum at . (B) When the true path of divergence really did resemble a random walk, then is expected. This might happen if stabilizing selection on the phenotype was ineffective, or if the optimum value wandered erratically. Systematically smaller values of are predicted under two conditions. Either (C) genomic divergence continued, despite effective stabilizing selection on the phenotype, leading to “system drift.” Or (D) populations successfully tracked environmental optima, but without leading to a straight path of substitutions. (E)–(G) also plays a key role in determining patterns of hybrid fitness, especially with locally adapted parents. Results are shown for the standard crosses, in three different environments, where the optimal phenotype coincides with: (E) the P1 phenotype, (F) the P2 phenotype, and (G) the midparental phenotype. Color shows variation in , including the inflection points at (equal fitnesses for the F1 and fitter backcross), and (equal fitnesses for the less fit parent and the less fit backcross). All results use equation (17), with , and the appropriate values of and for each cross; but results are shown on an arbitrary scale, such that fitter hybrids are higher on the plots.
