
Fig 4.
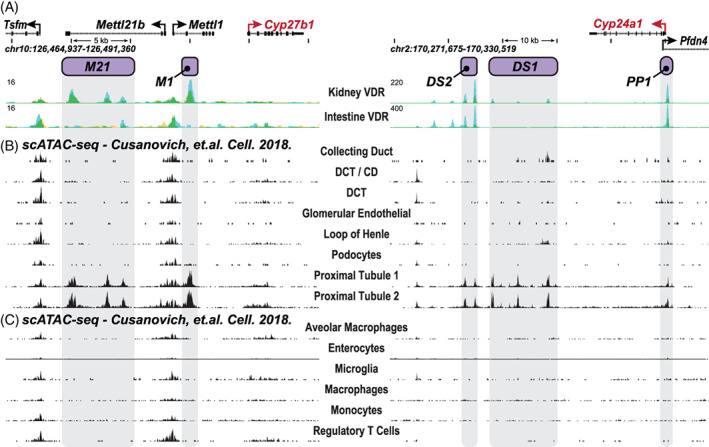
Single cell genome analyses of chromatin accessibility in renal and nonrenal cell types in the mouse. (A) ChIP‐seq analysis of VDR binding at the kidney cortex and intestine documenting the locations of the regulatory submodules (gray‐shaded dropdown bars) that mediate regulation by PTH (M1; purple) and FGF23 (M21, purple) as well as 1,25(OH)2D3 (M1 and M21). Data from Meyer et al.( 8 , 19 , 20 ) The upper panel indicates the chromosomal location of Cyp27b1 and Cyp24a1, genome scale, and the identity of adjacent genes. Arrows indicate the direction of gene transcription. As seen, the overall module is restricted to the kidney, where it is dispersed within single introns of the Mettl1 and Mettl21b genes, and absent in intestine (and all other tissues; see 8, 19, 20 )). (B,C) Single‐cell ATAC‐seq (scATAC‐seq) analysis by Cusanovich and colleagues.( 32 ) Raw data were reanalyzed and displayed for only the Cyp27b1 and Cyp24a1 gene loci for (B) ATAC‐seq analysis of individual renal cell types and (C) analysis of representative nonrenal cell types (emphasis on immune cell types). As seen, peaks representative of an open chromatin state align with each of the individual components that comprise the kidney‐specific module (M1 and M21) and are restricted to renal proximal tubules (two separate analyses). No other renal or nonrenal cells types retain this chromatin regulatory pattern.