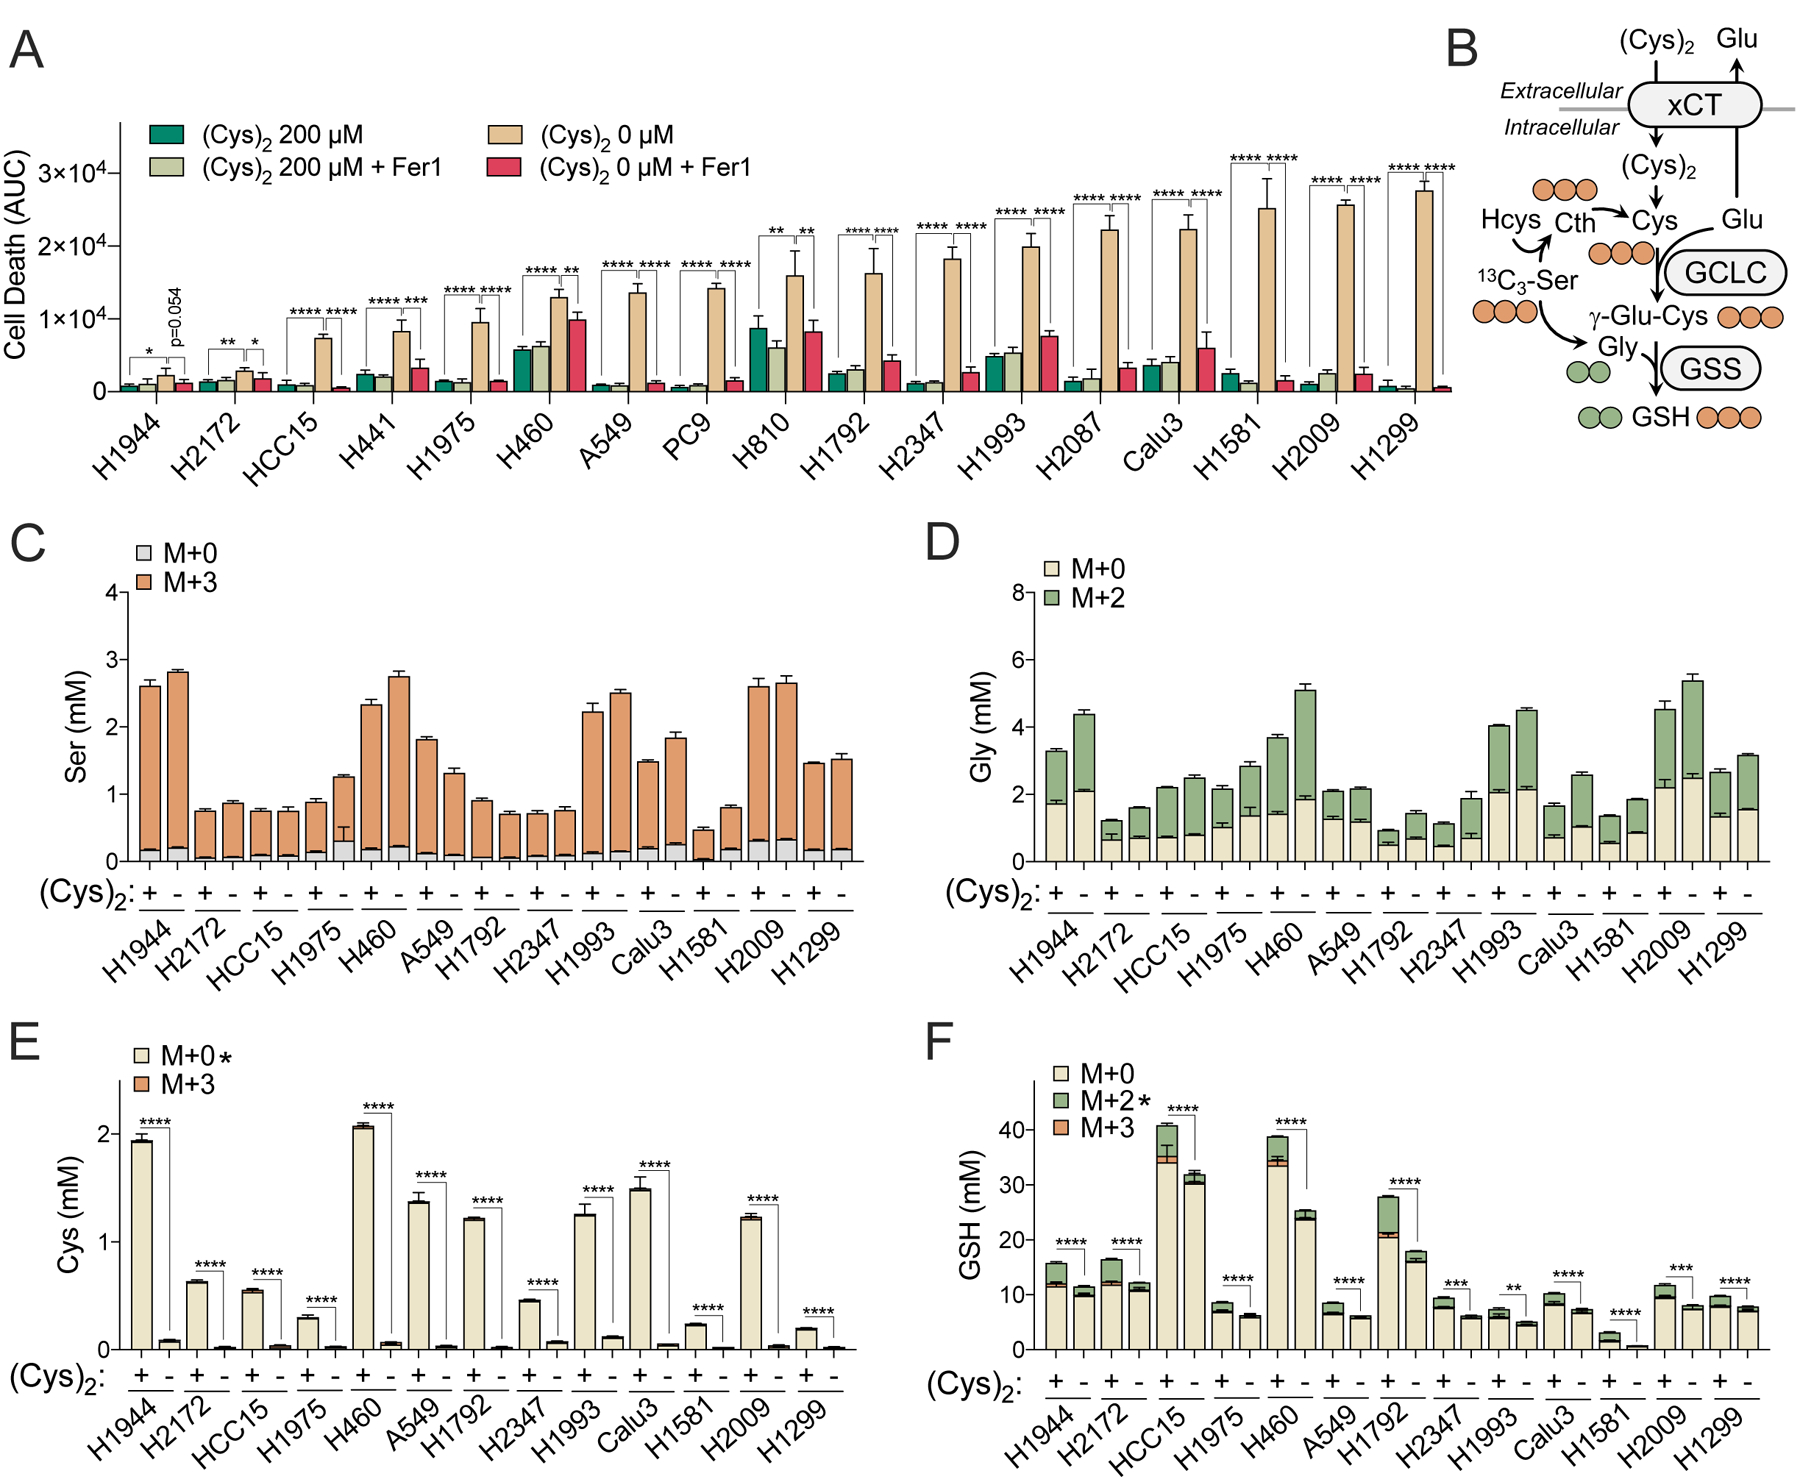
Figure 1. Transsulfuration cannot support NSCLC cysteine pools.

(A) Measurement of NSCLC cell death under cystine starved (0 mM) or replete (200 mM) conditions treated with Vehicle (0.1% DMSO) or Ferrostatin-1 (Fer-1, 10 μM) (N=4). Cell death was determined by Incucyte analysis of Sytox Green staining over 73 hrs, followed by normalization to cell density. Area under the curve (AUC) calculations are presented here. Full curves can be found in Figure S1D. (B) Schematic depiction of [13C3]-serine tracing into cysteine (M+3, 3 carbons labeled) and glutathione (M+2, 2 carbons labeled from glycine; M+3, 3 carbons labeled from cysteine). (C-F) Quantitation of [13C3]-serine tracing into (C) serine, (D) glycine, (E) cysteine, and (F) glutathione (GSH) following culture under cystine starved (−) or replete (+) conditions for 4 hrs (N=3). For A and C-F, data are shown as mean ± SD. N is number of biological replicates. *P<0.05, **P<0.01, ***P<0.001, and ****P<0.0001. For A, a one-way ANOVA with Bonferroni’s multiple comparison test was used for statistical analyses. An unpaired two-tailed t test was used for the statistical comparisons between non-labeled M+0 fraction in E and M+2 labeling fractions in F.
