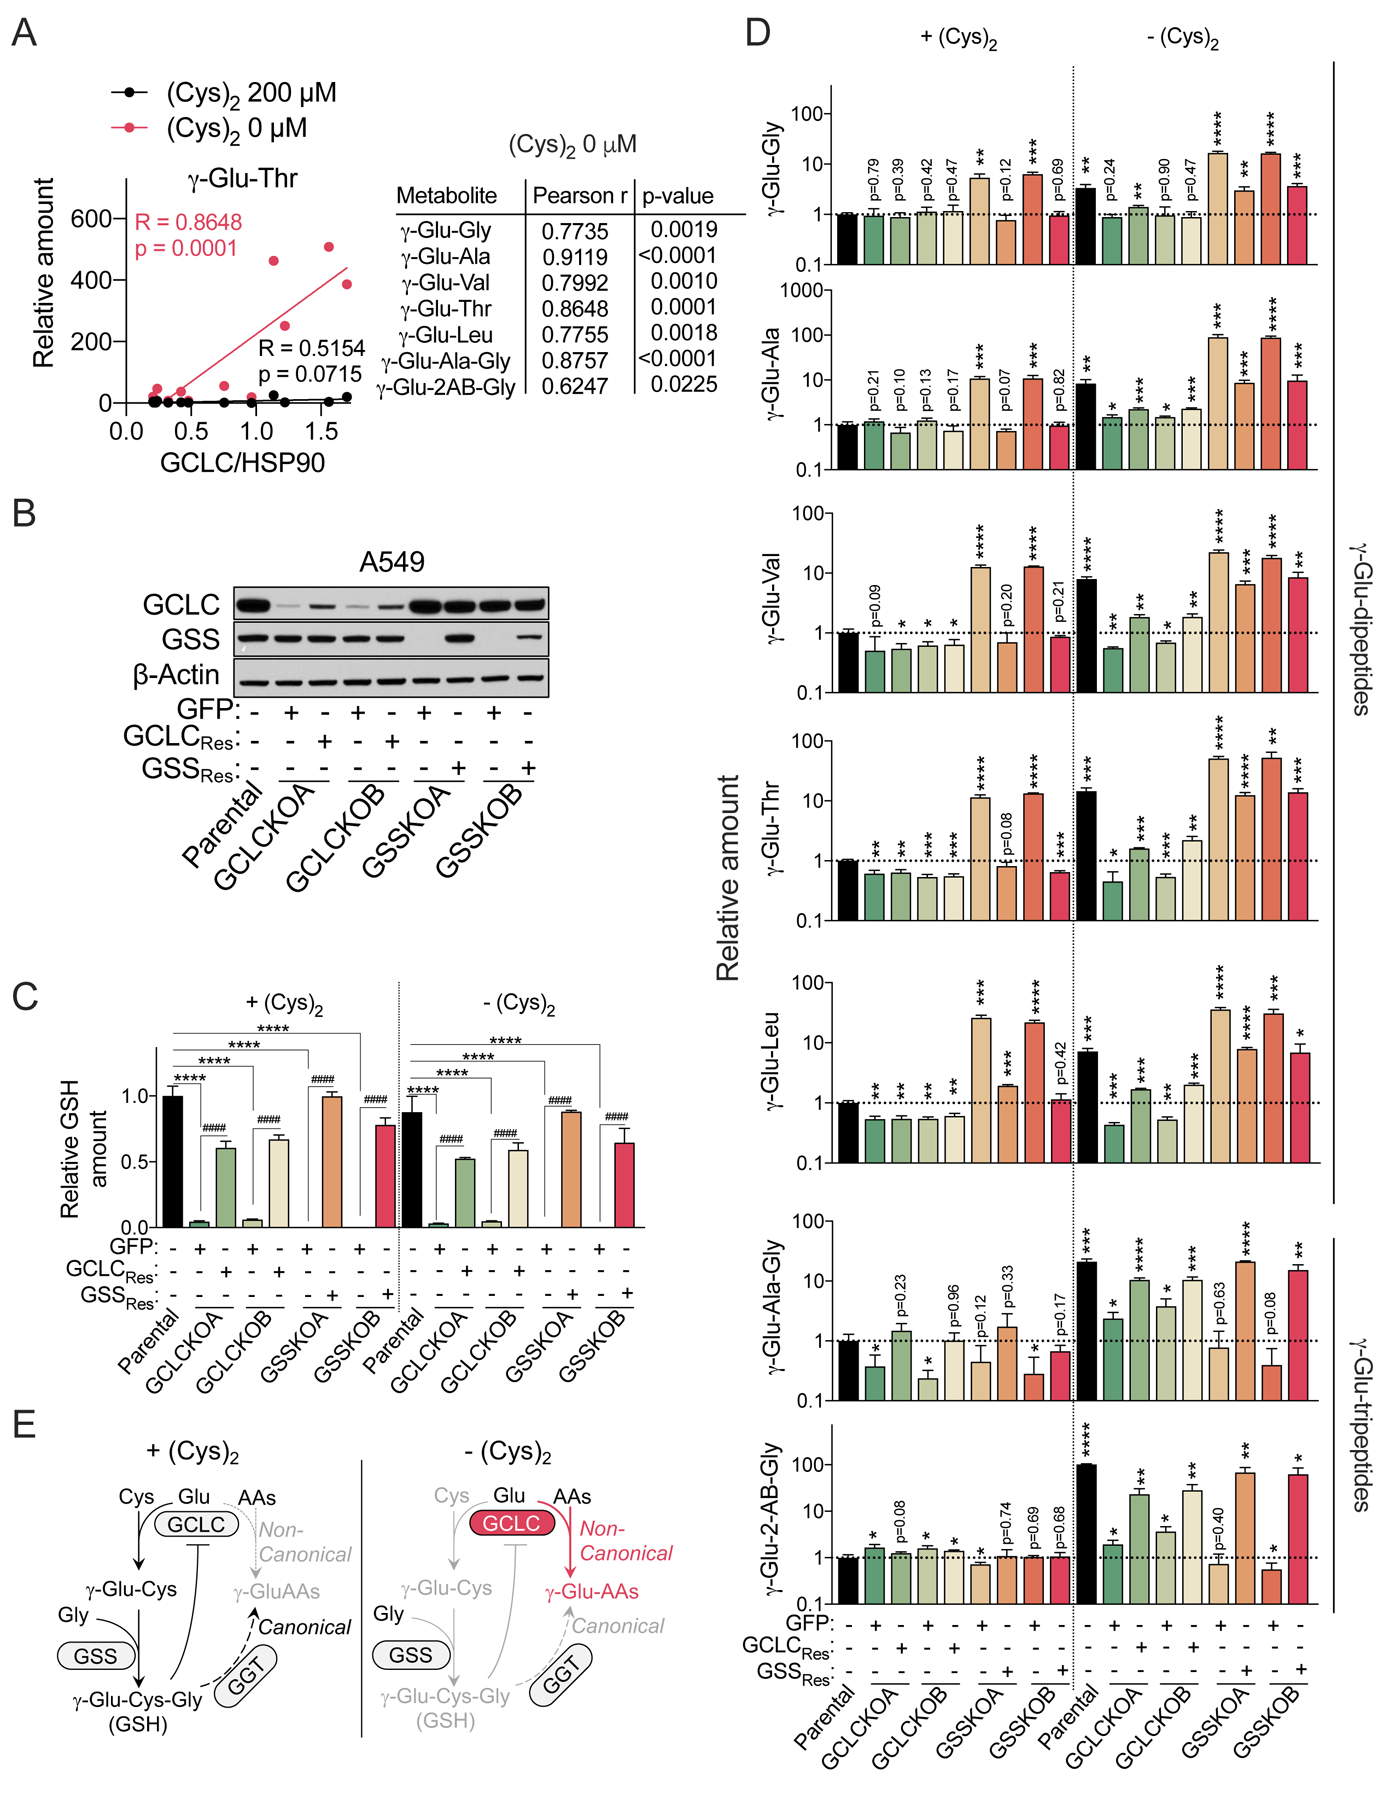
Figure 3. GCLC mediates γ-glutamyl-peptide synthesis in cell culture.

(A) Correlation of γ-Glu-dipeptides (data from Figure 2D) with GCLC expression in NSCLC cell lines. The GCLC protein expression of each cell line was normalized to the amount of HSP90 protein. The western blot can be found in Figure 5A. (B) Representative immunoblots of parental A549 cells, GCLC KO clones reconstituted with GFP (+GFP) or sgRNA-resistant GCLC (+GCLCRes), and GSS KO clones reconstituted with GFP (+GFP) or sgRNA-resistant GSS (+GSSRes). β-actin was used for the loading control. (C-D) Intracellular GSH levels (C) and γ-Glu-peptides levels (D) in the cells from (B) under cystine replete or starved conditions for 2.5 hrs (N=3). The data were normalized to the mean value of parental A549 cells under cystine replete conditions. (E) Schematic depicting the non-canonical, γ-Glu-peptide synthesis activity of GCLC. For C and D, data are presented as mean ± SD. n.d., not detected. N is number of biological replicates. *P<0.05, **P<0.01, ***P<0.001, and ****P<0.0001; ##P<0.01, ###P<0.001, ####P<0.0001. For C, a one-way ANOVA with Bonferroni’s multiple comparison test was used for statistical analyses for the comparison of Parental, GCLCKOA/B + GFP, and GSSKO A/B + GFP. For the comparison between GCLC KO or GSS KO group (GCLCKO A/B + GFP or GSSKO A/B + GFP) and their GCLC or GSS reconstituted group (GCLC KOA/B + GCLCRes or GSSKO A/B + GSSKOA/B + GSSRes), an unpaired two-tailed t test was used. For D, an unpaired two-tailed t test was used for the comparison with parental cells under cystine replete conditions [+(Cys)2].
