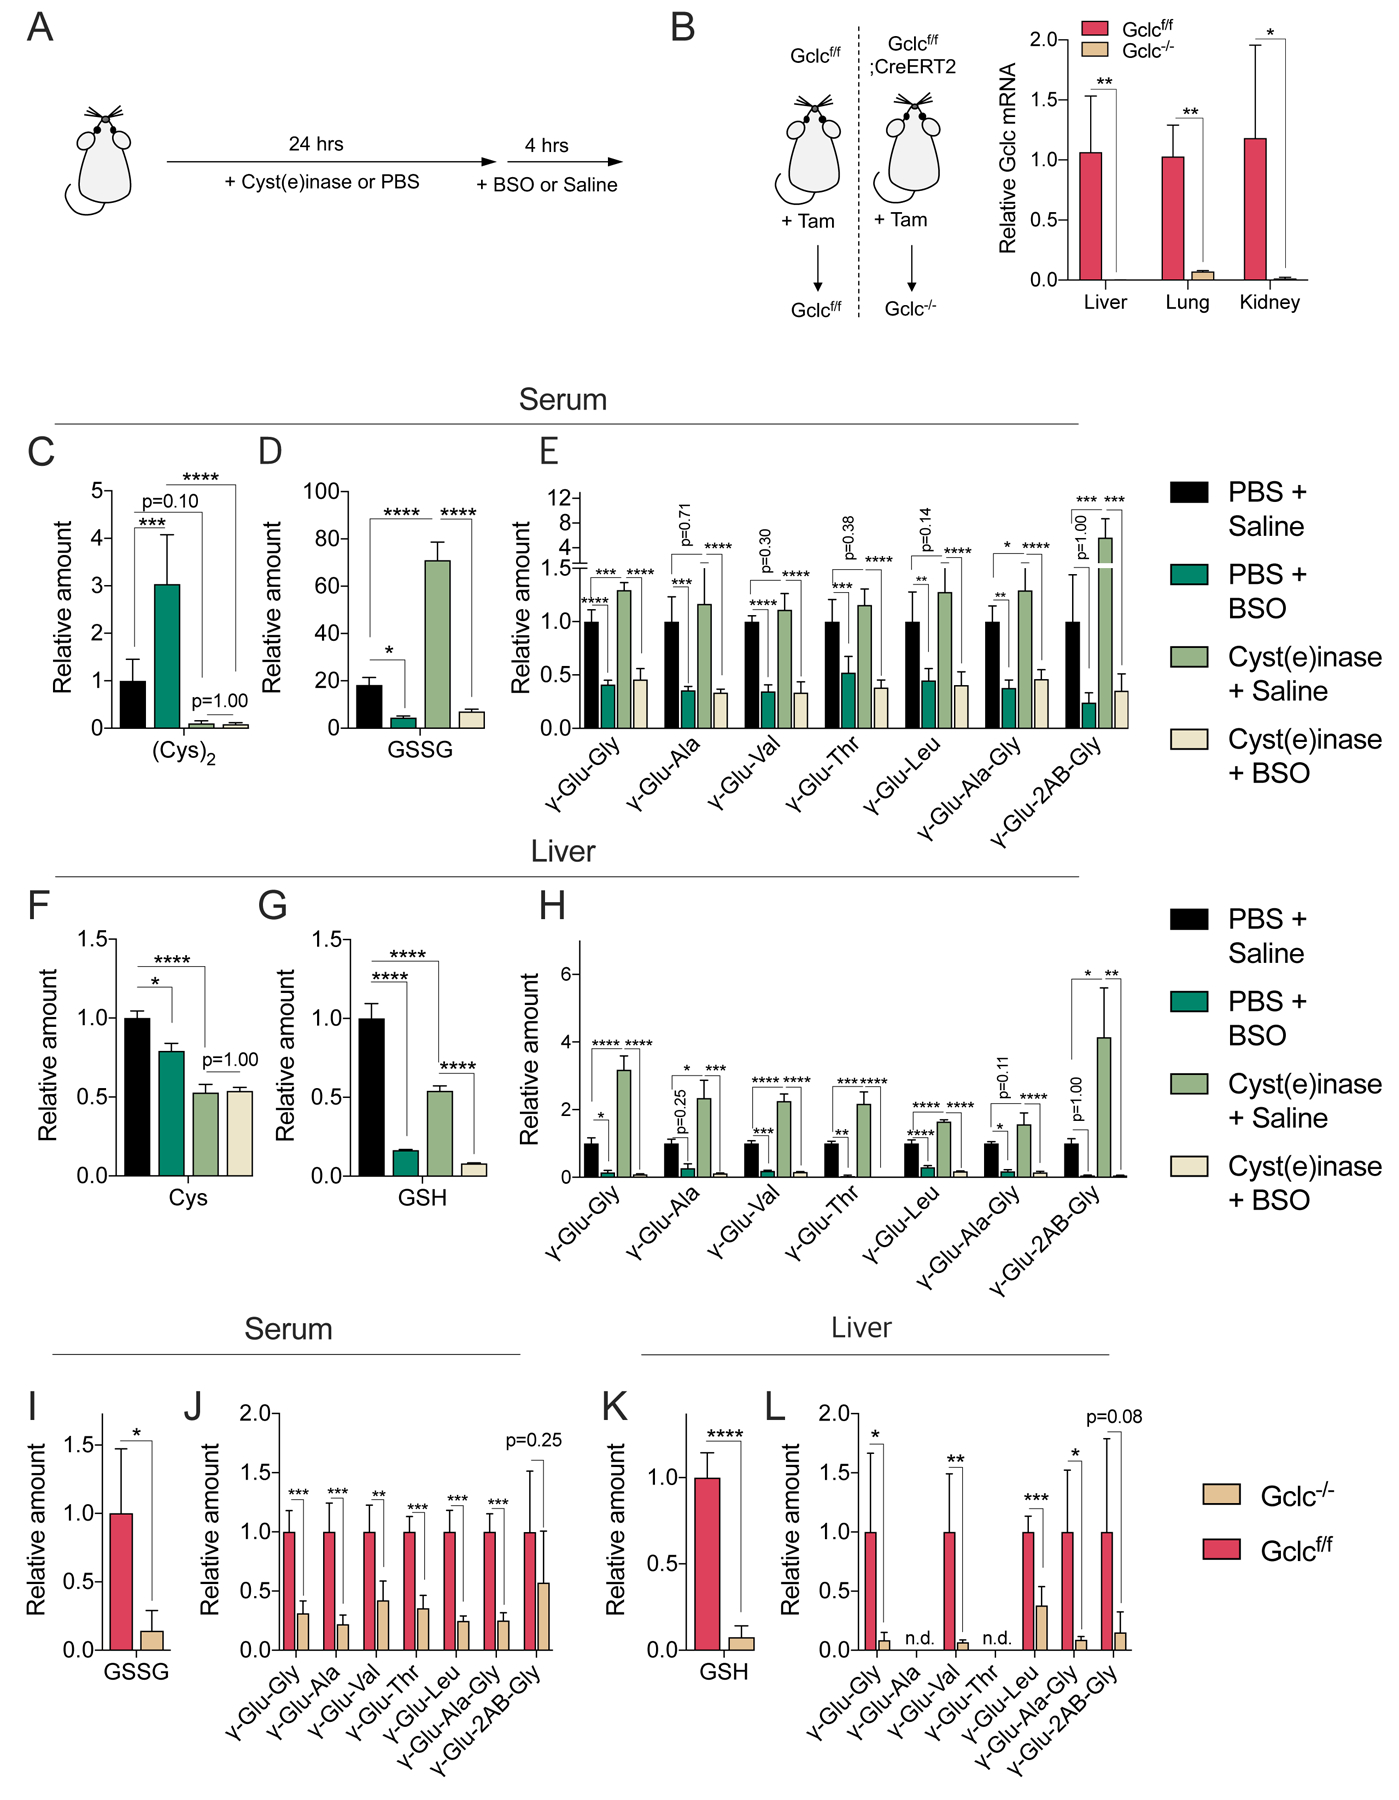
Figure 4. GCLC mediates γ-glutamyl-peptide synthesis in vivo.

(A) Schematic depicting the Cyst(e)inase and BSO treatment schedule for the depletion of extracellular cyst(e)ine and inhibition of Gclc. Cyst(e)inase (75 mg/kg) or vehicle (PSB) were administered, followed by treatment with BSO (100 mmol/kg) or vehicle (saline) 24 hours later. Tissues were collected after 4 hrs. (B) Evaluation of Gclc mRNA expression after tamoxifen (Tam)-inducible Gclc deletion in the adult mouse. Gclcf/f (control, Gclc functional) and Gclc−/− (Gclc knockout). The mRNA levels are normalized to the mean value of Gclcf/f mouse tissues (N=4). (C-E) Analysis of serum cystine (C), GSSG (D), and γ-Glu-peptide levels (E) in mice treated with Cyst(e)inase/BSO. (F-H) Analysis of liver cysteine (F), GSH (G), and γ-Glu-peptide levels (H) in the mice from (C-E). The metabolite levels are normalized to the mean value of PBS/saline treated mice (N=5). (I-J) Analysis of serum GSSG (I) and γ-Glu-peptide levels (J) in Gclcf/f and Gclc−/− mice. (K-L) Analysis of and liver GSH (K) and γ-Glu-peptide levels (L) in the mice from (I-J). The metabolite levels are normalized to the mean value of Gclcf/f mice (N=4). For B-L, data are presented as mean ± SD. N is number of biological replicates. n.d., not detected. *P<0.05, **P<0.01, ***P<0.001, and ****P<0.0001. For B and I-L, an unpaired two-tailed t test was used for the statistical comparisons. For C-H, a one-way ANOVA with Bonferroni’s multiple comparison test was used for statistical analyses.
