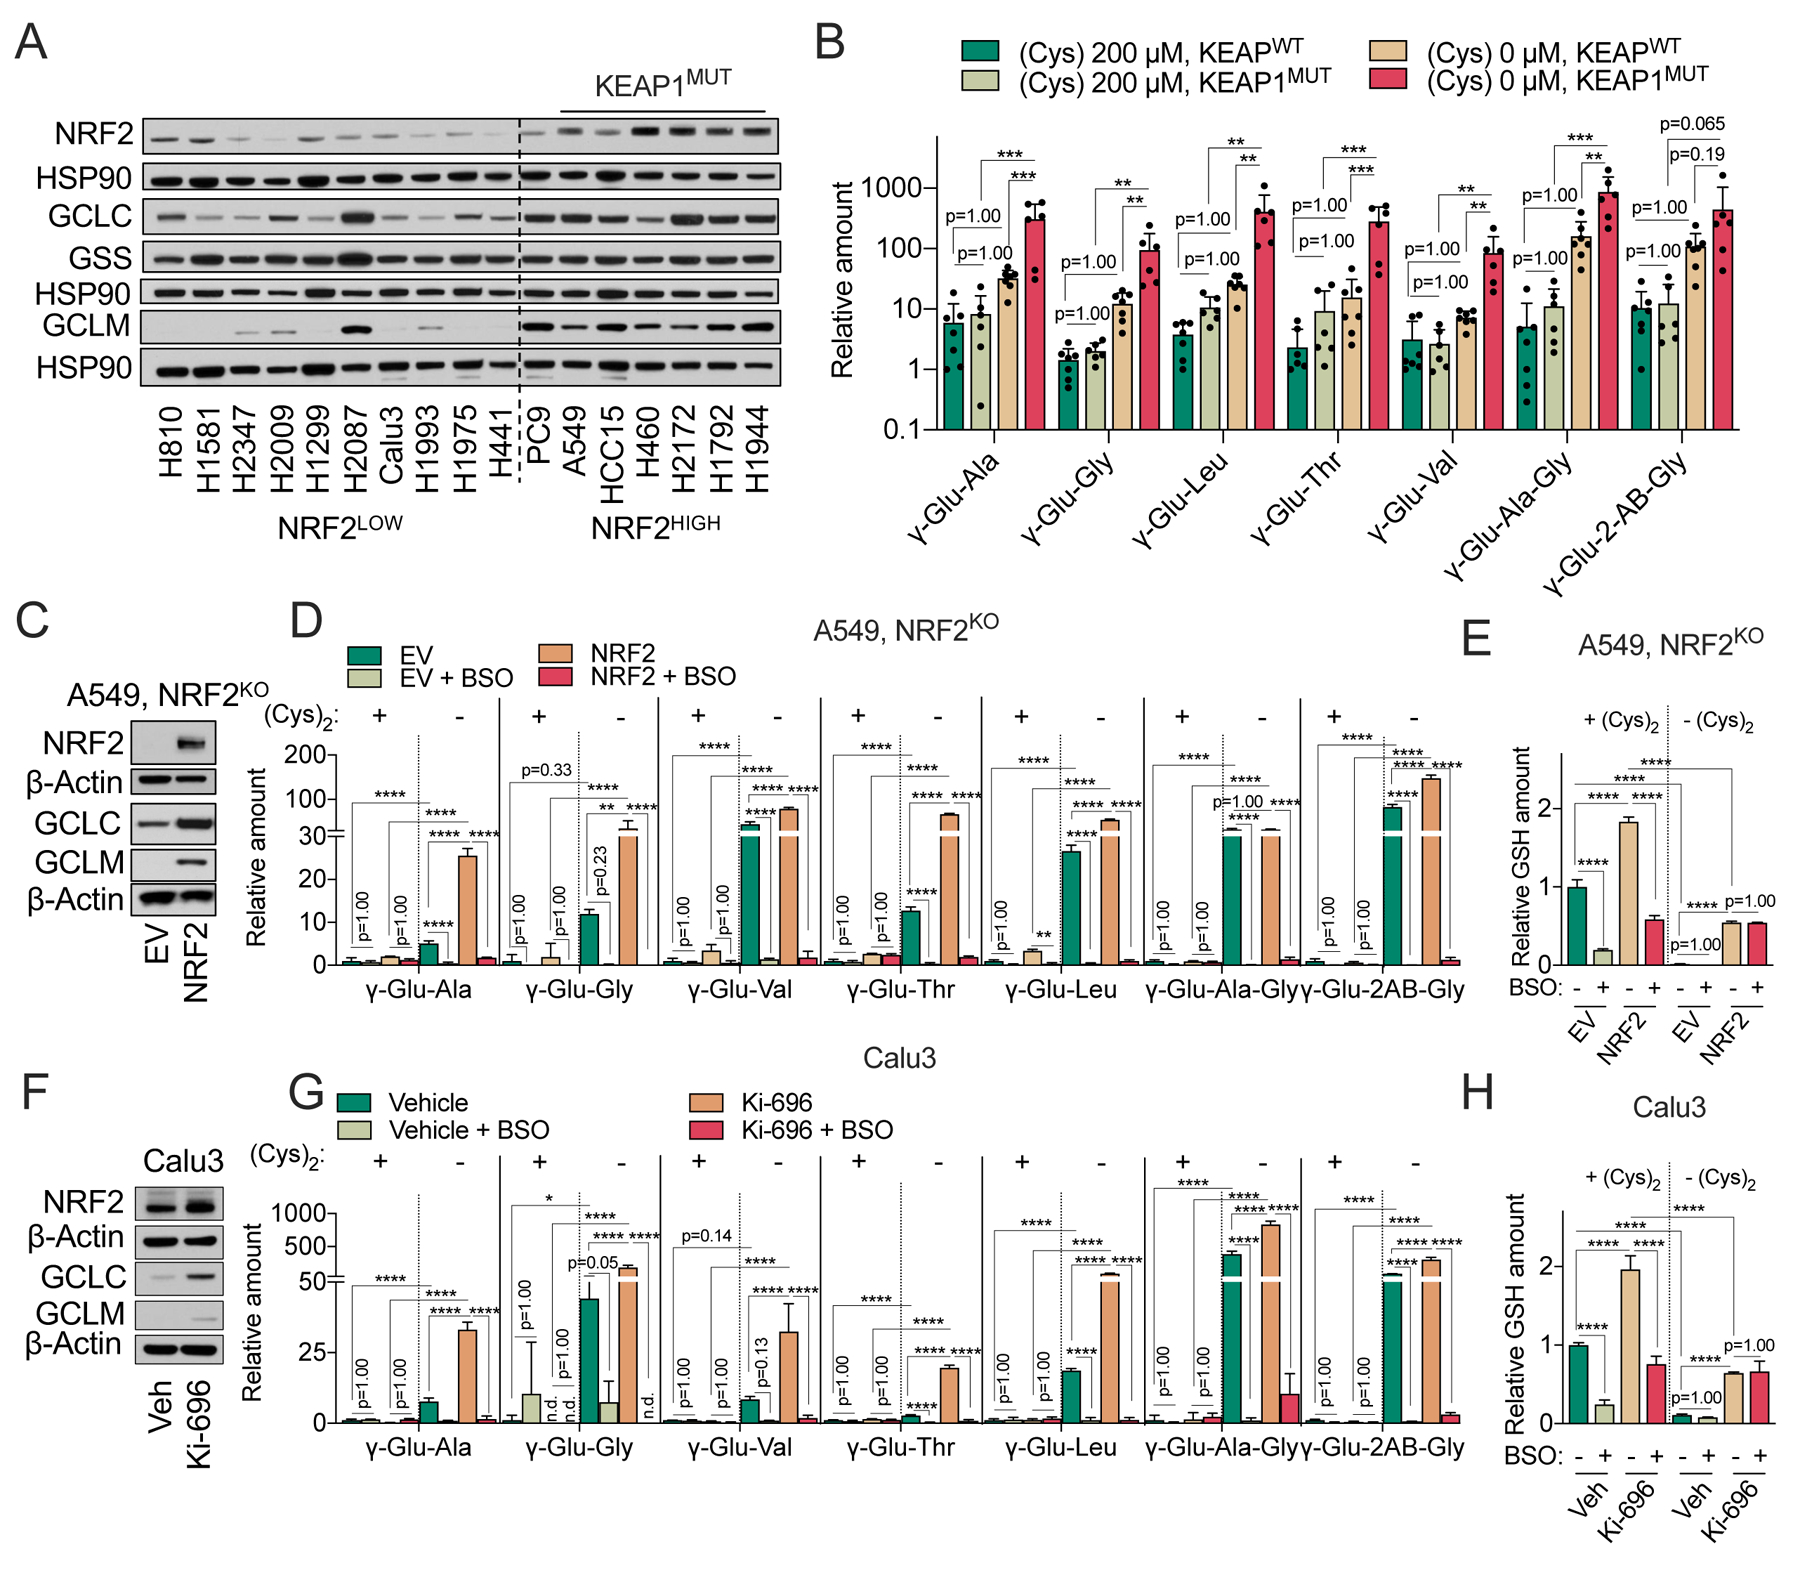
Figure 5. NRF2 promotes γ-glutamyl-peptide synthesis via GCLC.

(A) Representative immunoblot of NRF2, GCLC, GSS, and GCLM expression in NRF2LOW and NRF2HIGH (KEAP1 mutant: A549, HCC15, H460, H2172, H1792, and H1944) NSCLC cell lines. HSP90 is used as loading control. (B) Comparison of γ-Glu-dipeptide levels in KEAP1WT and KEAPMUT NSCLC cell lines. Individual cell line data are found in Figure 5SA, and also correspond to the data in Figure 2D. The γ-Glu-peptides were analyzed following culture in cysteine replete and starved conditions for 12 hrs and normalized to the mean value of H1581 cells under cystine replete conditions. (C) Representative immunoblot of NRF2, GCLC, and GCLM expression in NRF2 KO A549 cells transduced with empty vector (EV) or NRF2. β-actin is used as loading control. (D-E) Analysis of intracellular γ-Glu-dipeptides (D) and GSH levels (E) in the cells from (C) under cystine replete or starved conditions in the presence and absence of 100 μM BSO for 12 hrs. (F) Representative immunoblot of NRF2, GCLC, and GCLM expression in Calu3 cells pre-treated with 100 nM of KI-696 or vehicle (Veh, 0.1% DMSO) for 48 hrs. b-actin is used as loading control. (G-H) Analysis of intracellular γ-Glu-dipeptides (G) and GSH levels (H) in the cells from (F) under cystine replete or starved conditions in the presence and absence of 100 μM BSO for 12 hrs. For B, D, E, G, and H, data are presented as mean ± SD. N is number of biological replicates. n.d., not detected. **P<0.01, ***P<0.001, and ****P<0.0001. For B, D, E, G, and H, a one-way ANOVA with Bonferroni’s multiple comparison test was used for statistical analyses.
