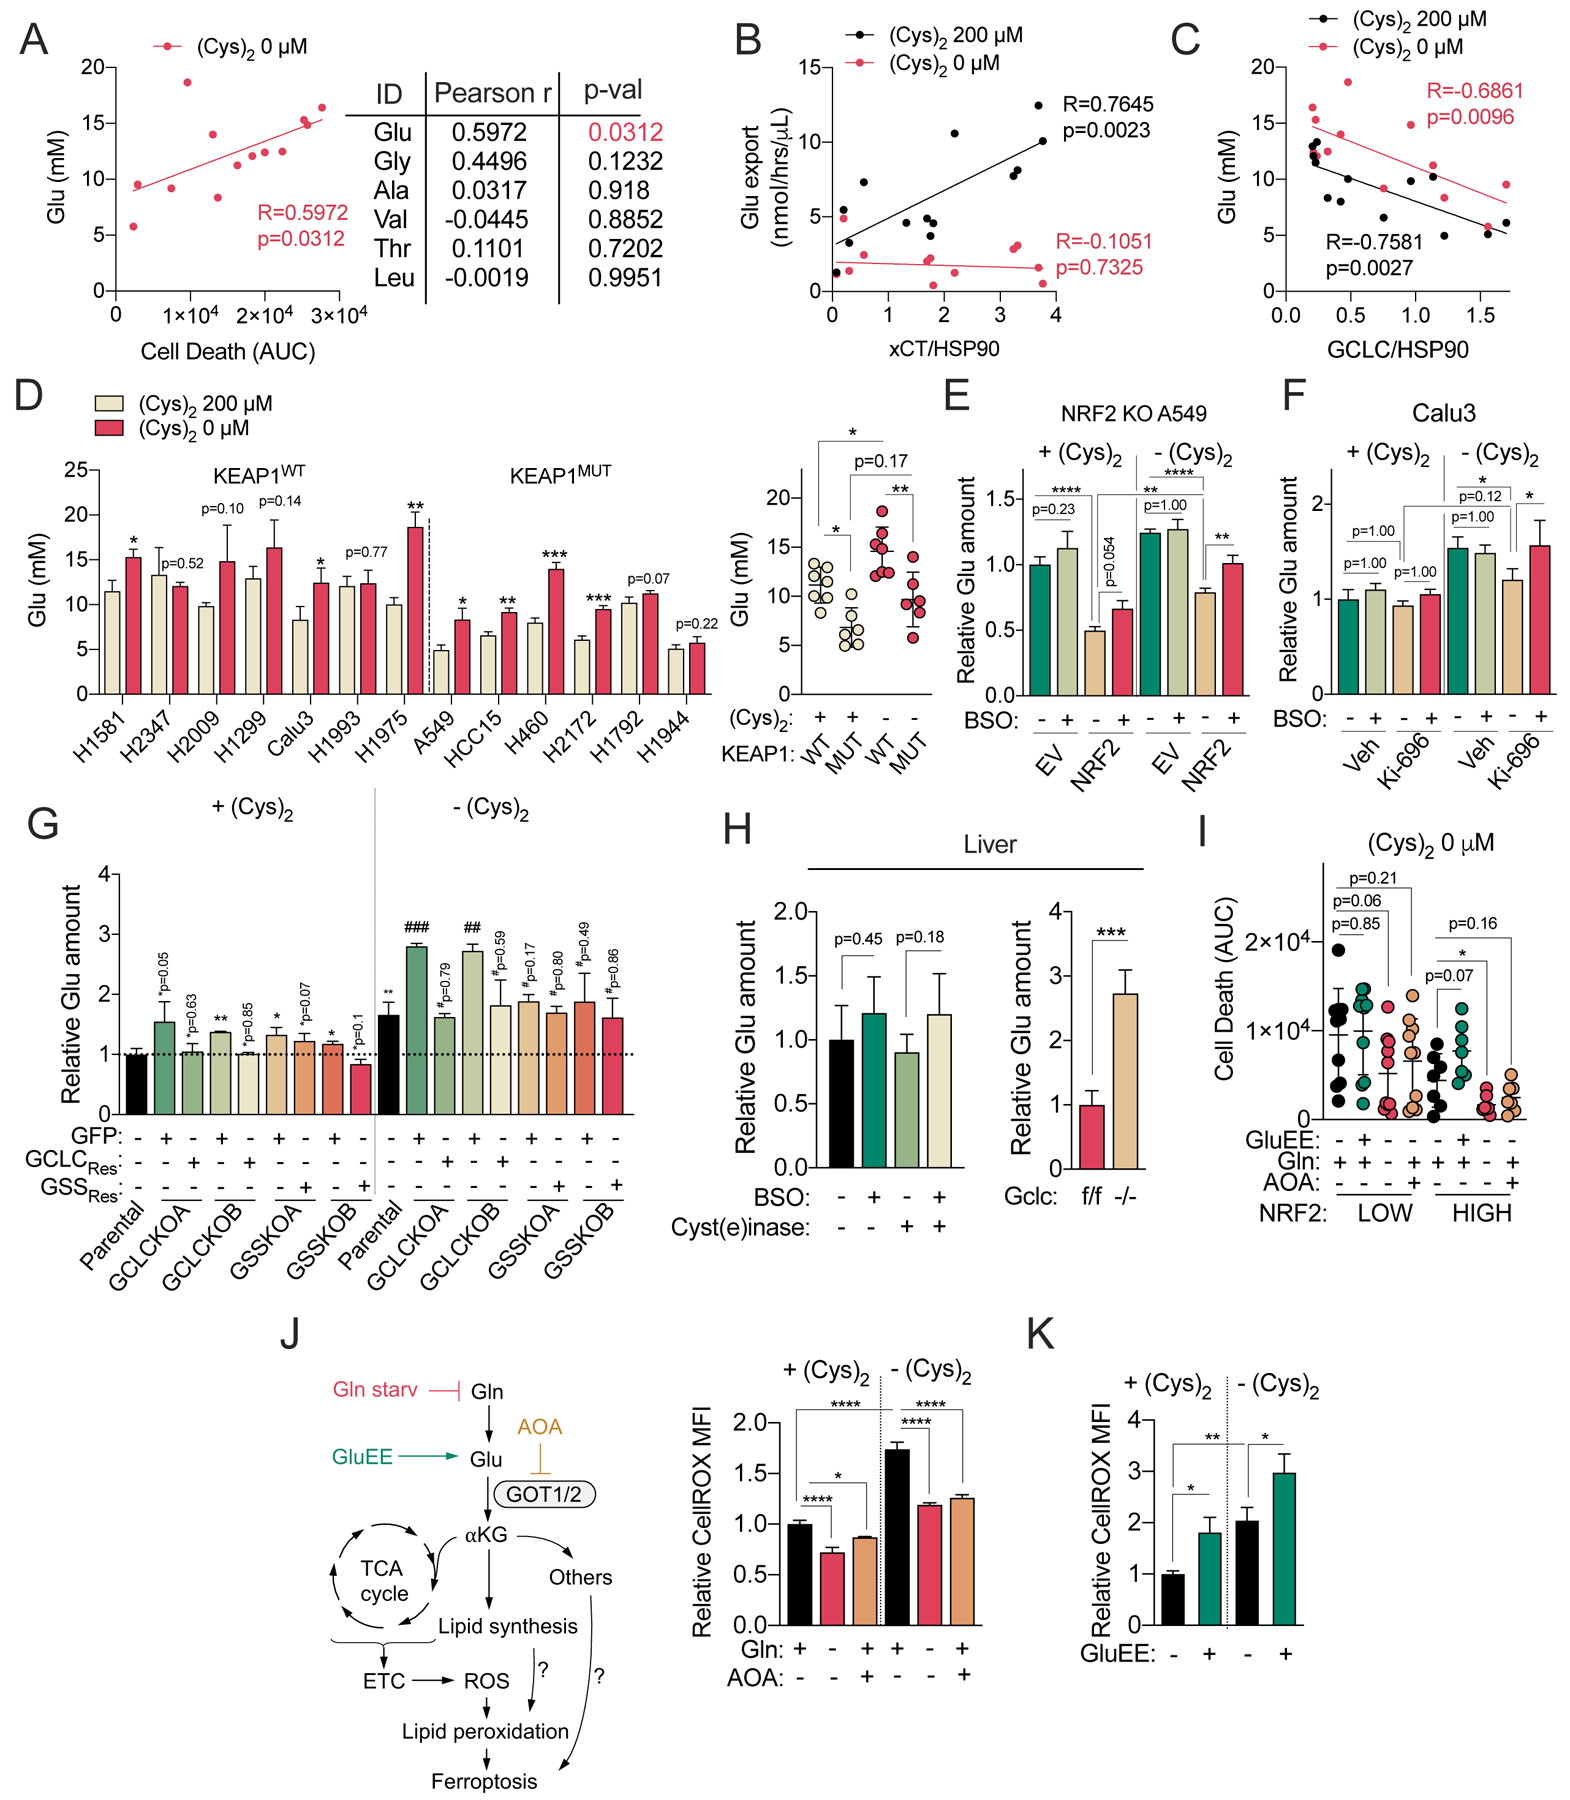
Figure 7. Dipeptide synthesis scavenges glutamate.

(A) Correlation between the intracellular concentrations of γ-Glu-peptide substrate amino acids (Glu, Gly, Ala, Val, Thr, Leu) following cystine starvation for 12 hours and cystine starvation AUCs (from Figure 1A) (N=13). Individual cell line Glu concentrations can be found in Figure 7D. (B) Correlation between xCT protein expression and the Glu export rate under cystine replete and starved conditions for 12 hrs in NSCLC cells. xCT expression is normalized to HSP90 expression and can be found in Figure S7A (N=13). (C) Correlation between GCLC protein expression and intracellular Glu levels following NSCLC culture in cysteine replete and starved conditions for 12 hours. GCLC expression is normalized to HSP90 expression and can be found in Figure 5A (N=13). (D) (Left) Analysis of intracellular Glu concentrations in NSCLC cell lines cultured under cystine replete or starved conditions for 12 hrs (N=3). (Right) Comparison of Glu concentrations between KEAP1 WT (N=7) and KEAP1 MUT NSCLC (N=6) cells. (E) Analysis of relative intracellular Glu levels in the NRF2 KO A549 cells transduced with empty vector (EV) or NRF2 cultured under cystine replete or starved conditions in the presence and absence of 100 μM BSO for 12 hrs (N=3). (F) Analysis of relative intracellular Glu levels in the Calu3 cells pre-treated with 100 nM of KI-696 or vehicle (Veh, 0.1% DMSO) for 48 hrs, followed by culture in cystine replete or starved conditions in the presence and absence of 100 μM BSO for 12 hrs (N=3). (G) Analysis of relative intracellular Glu levels of the parental A549 cells, GCLC KO clones reconstituted with GFP (+GFP) or sgRNA-resistant GCLC (+GCLCRes), and GSS KO clones reconstituted with GFP (+GFP) or sgRNA-resistant GSS (+GSSRes) cultured under cystine replete or starved conditions for 2.5 hrs (N=3). (H) (Left) Relative Glu levels in mouse liver treated with Cyst(e)inase or vehicle (PBS) for 24 hrs followed by treatment with BSO or vehicle (saline) for 4 hrs (for all exp group, N=5), and (Right) Relative Glu levels in the liver of Gclcf/f and Gclc−/− mice (for all exp group, N=4). (I) Analysis of the death of NRF2LOW (N=10) and NRF2HIGH (N=7) cells under cystine starved conditions treated with GluEE (5 mM) or AOA (0.5 mM), or Gln starvation for 49 hrs. Cell death was analyzed with Sytox Green and the mean AUC of each cell lines can be found in Figure S7I. (J) Analysis of intracellular A549 ROS levels with CellROX green following culture under cystine replete and starved conditions in the presence and absence of AOA (0.5 mM) or Gln starvation for 14 hrs (N=3). (K) Analysis of intracellular A549 ROS levels with CellROX green following culture under cystine replete and starved conditions in the presence and absence of GluEE (5 mM) for 8 hrs (N=3). (L) Schematic depiction of the GSH-independent, non-canonical role of GCLC in the protection against ferroptosis by maintaining glutamate homeostasis under cystine starvation. For D-K, data are presented as mean ± SD. N is number of biological replicates. *P<0.05, **P<0.01, ***P<0.001, and ****P<0.0001. For A-C, a Pearson correlation analysis was used. For D (left), G, H (right), and I, Unpaired two-tailed t tests were used for the statistical comparisons. For G, * is for the comparison with parental cells under cystine replete conditions [+(Cys)2] and # is for the comparison of parental group under cystine starved conditions [−(Cys)2]. For D (right), E, F, H (left), J, and K, one-way ANOVA with Bonferroni’s multiple comparison tests were used for statistical analyses.
