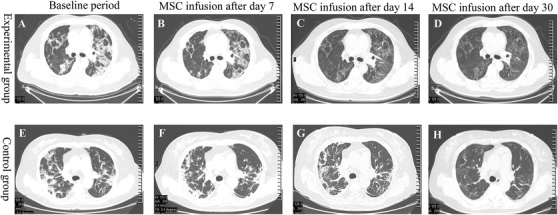
FIGURE 3.

Representative chest CT images at various points during 1‐month follow‐up after MSC transplantation. Images shown are from baseline (A), day 7 (B), day 14 (C), and day 30 (D) following MSC transplantation in the experimental group as well as baseline (E), day 7 (F), day 14 (G), and day 30 (H) of the observation period for the control group. There was a statistically significant difference between the groups in the improvement rate of chest imaging results in the first month after MSC infusion. Representative CT images clearly show improved results at days 7, 14, and 30 for both groups
