Fig. 7.
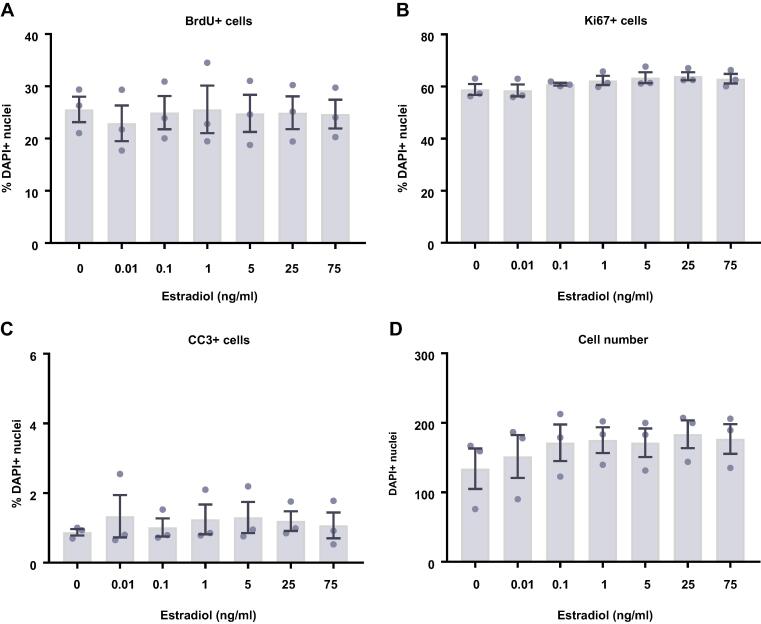
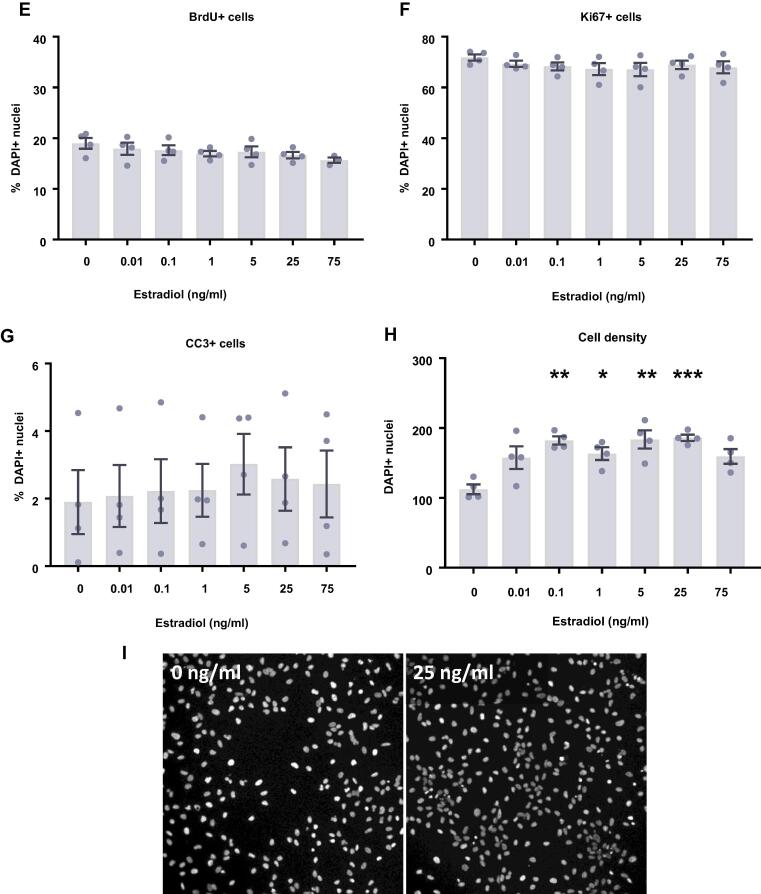
Cellular marker quantification following 24 h and 48 h of proliferation with estradiol. HPCs were treated with differing concentrations of estradiol for 24 h (A–D) or 48 h (E–H) while cells were maintained in a proliferative state. Each graph indicates the proportion of DAPI-positive cells staining positively for each marker. (A) 24 h estradiol treatment had no impact on the proportion of cells synthesising new DNA as indicated by BrdU staining. (B) It also did not change the number of cells in the cell cycle as indicated by KI67 staining. (C) There was no difference in the proportion of apoptotic cells as shown by CC3 staining. (D) Despite there being a slight increase in cell density with increasing estradiol concentration, this was not significant. (E) Estradiol treatment had no impact on the proportion of cells synthesising new DNA as indicated by BrdU staining after 48 h. (F) It also did not change the number of cells in the cell cycle as indicated by KI67 staining. (G) There was no difference in the proportion of apoptotic cells as shown by CC3 staining. (H) Estradiol increases cell density, particularly treatments of 0.1, 1, 5 and 25 ng/ml. Group differences were detected using a one-way ANOVA followed by Bonferroni’s post-hoc test. Significantly different groups were considered when p < 0.05. *Indicates a significant difference compares to 0 ng/ml. N = 4 for all groups. (I) Representative images of the 0 and 25 ng/ml 48 h estradiol treatment groups illustrating the increase in cell density. Nuclei stained with DAPI. Scale bar = 100 μm.


