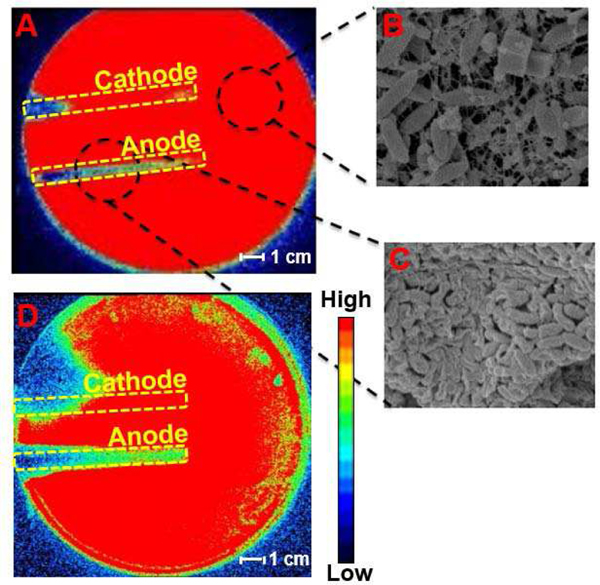
Fig. 3.
(a) The IVIS image of post-24 h treatment of the powered electrodes to PA 24 hr lawn. Red represents metabolically active/live and blue/black represents metabolically inactive or killed bacteria. (b) The SEM image of the PA biofilm on the area of the gel not directly above the electrodes acts as control for untreated area. (c) The SEM image of the PA biofilm on an area directly above the anode that was powered for 24 hr. The breakdown of EPS is visible. (d) The IVIS image of post-24 h treatment of the powered electrodes to SA 24 h lawn.

