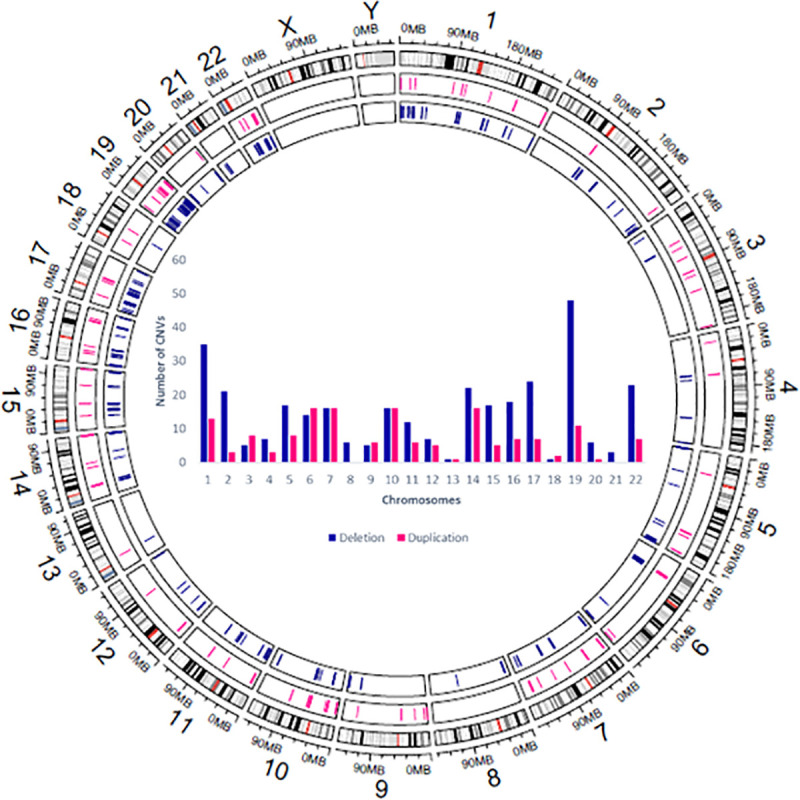
Fig 1. Chromosomal distribution of CNVs among the studied breast cancer patients.

The Circos plot generated using Circlize R package [40] summarizes all CNV regions identified in the 9 breast cancer patients. On each chromosome the first track indicates localization of deletions and the second track designates localization of duplications. The central Histogram illustrates the number of deletions and duplications detected on each chromosome.
