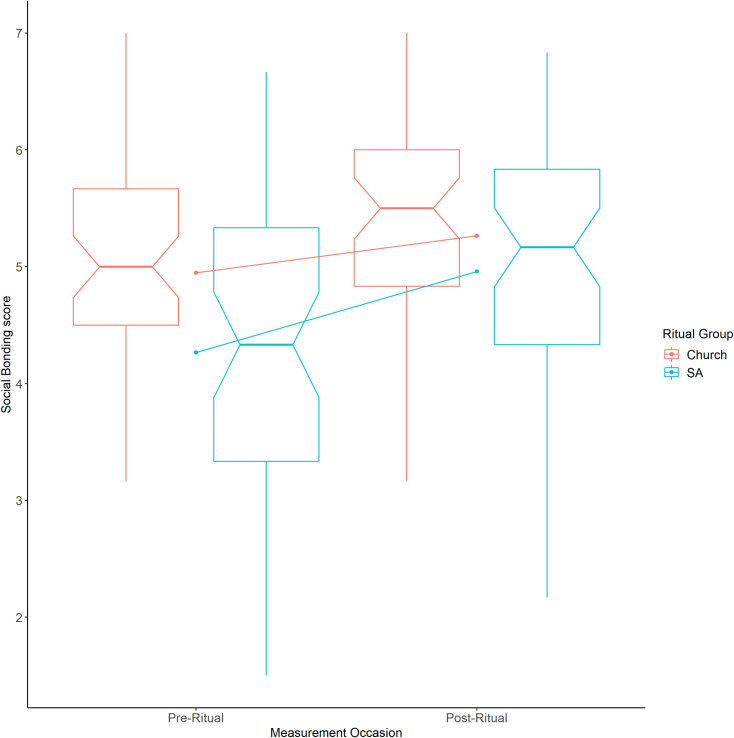
Fig 2.
Notched boxplot showing pre-ritual and post-ritual social bonding in Sunday Assembly (blue) and Church (red) participants. The notch (indent) around the median shows the 95% confidence interval. The whiskers are +/- 1.5*IQR from the upper and lower quartiles. The diagonal lines show the mean change for the two sets of participants.

