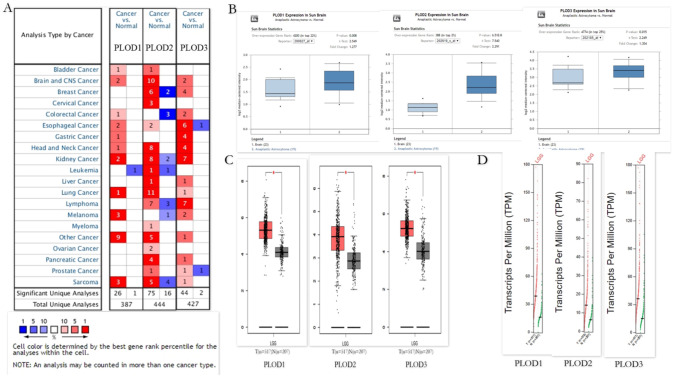
Fig 1. The expression of PLOD family members in different tissues.
(A) The transcription levels of PLOD family members in different types of cancers Red, upregulation; blue, downregulation. The number in each cell indicates the datasets that met the set threshold in each cancer type. Cell color was defined as the gene rank percentile for analyses within the cell. (B) Expression levels of PLODs family members compared between subtypes of LGG and normal tissues from the Oncomine. (C) Boxplot results of the expression levels of PLODs family members in LGG analyzed using GEPIA. Red box, tumor samples; green box, normal samples. T, tumor; N, normal. (D) Expression profile of PLODs family members in LGG analyzed using GEPIA. Red trace, tumor samples; green trace, normal samples.

