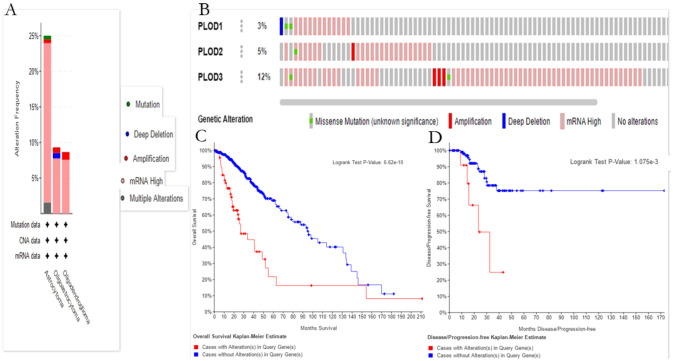
Fig 3. Alteration frequency and prognosis of the PLOD family genes in patients with LGG.
(A) The summary of the cancer types in the cBioPortal was used to calculate the percentages of LGG cases with of the PLOD family genes. (B) mRNA expression alterations (RNA Seq V2 RSEM) of the PLOD family genes in LGG patients. (C) OS and DFS/PFS of LGG patients with altered (red) and unaltered (blue) mRNA expression of the PLOD family genes. The red curves in the Kaplan-Meier plots includes all tumors with PLOD1/2/3 germline or somatic mutation, the blue curves include all samples without PLOD1/2/3 mutation.

