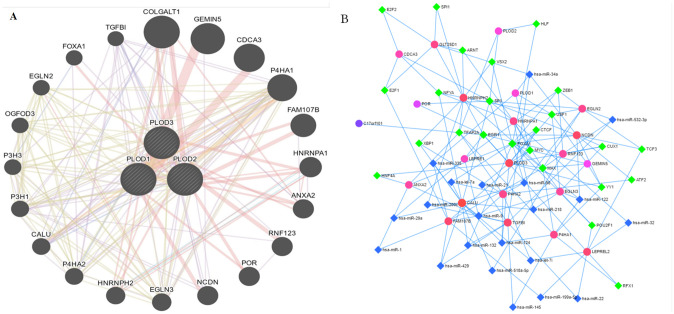
Fig 4. Gene-gene network and miRNA/TF prediction of PLOD family members in LGG.
(A) Gene-gene interaction network among PLOD family members. Each node represents a gene. The node size represents the strength of interactions, and the line color represents the types of interactions. (B) Transcription factor-miRNA (TF-miRNA) coregulatory network of significantly PLODs correlated genes.

