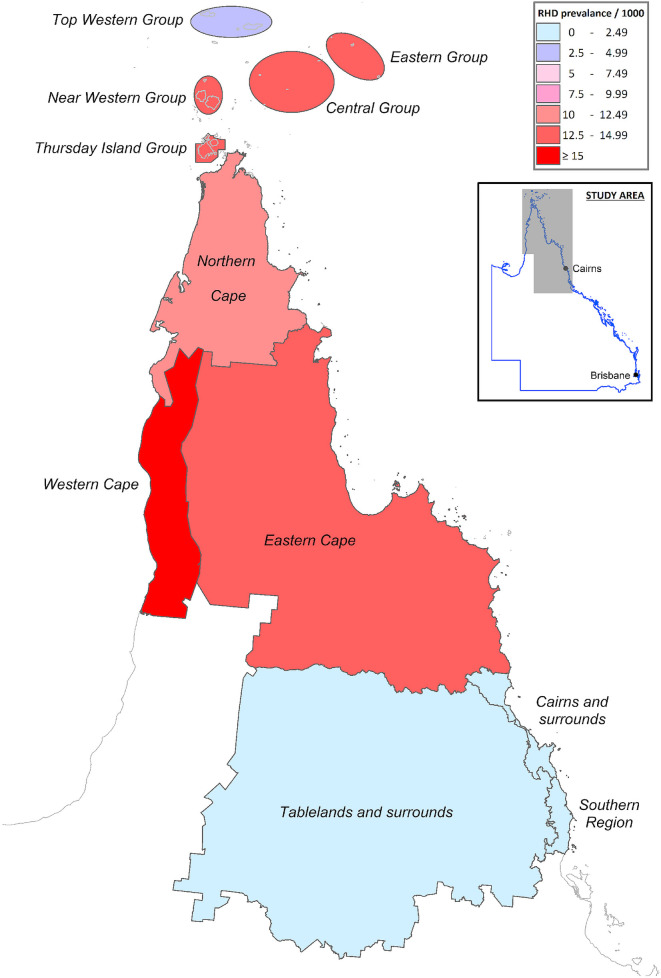
Fig 4. Regional prevalence of RHD in Far North Queensland.
The map was created using constructed using mapping software (MapInfo version 15.02, Connecticut, USA) using data provided by the State of Queensland (QSpatial). Queensland Place Names—State of Queensland (Department of Natural Resources, Mines and Energy) 2019, available under Creative Commons Attribution 4.0 International licence https://creativecommons.org/licenses/by/4.0/. ‘Coastline and state border–Queensland—State of Queensland (Department of Natural Resources, Mines and Energy) 2019, available under Creative Commons Attribution 4.0 International licence https://creativecommons.org/licenses/by/4.0/.

