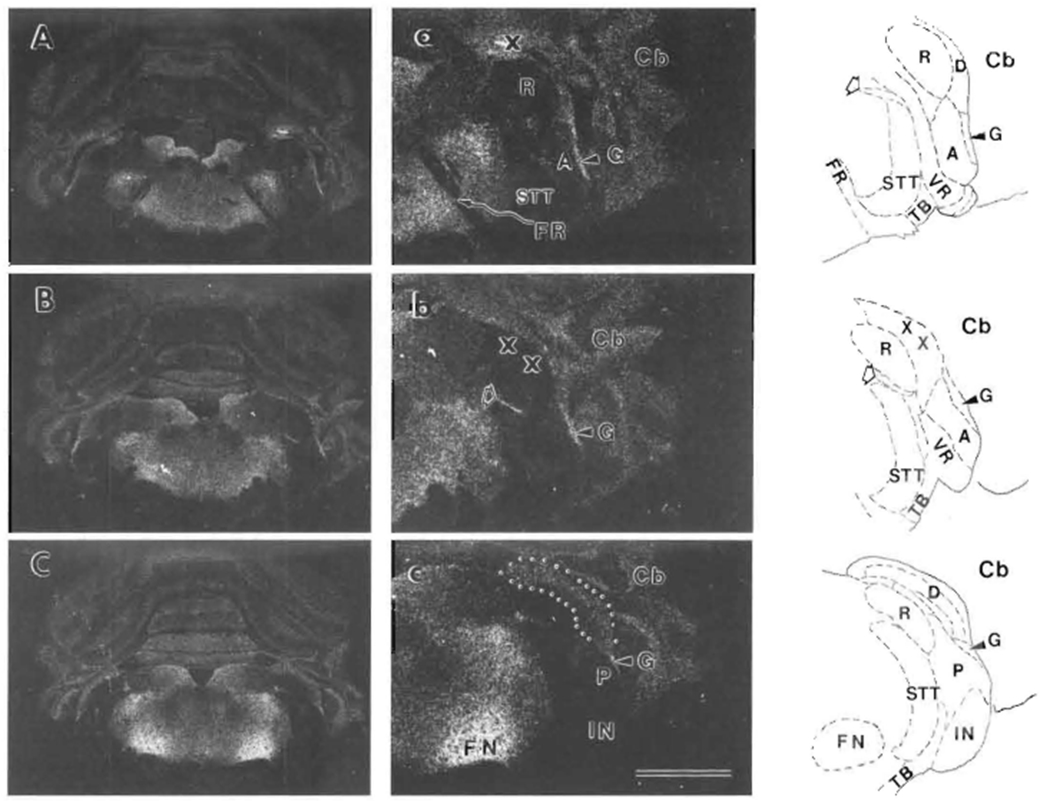
FIGURE 1. Autoradiographic images of [3H]NMS binding sites in rat CN and nearly regions.

Tranverse sections through the lower brainstem are shown from more rostral (A) to more caudal (C). Higher magnification views of CN and nearby regions from the right sides of (A), (B) and (C) are shown in (a), (b) and (c). Tracings of the right sides of these same 3 sections after staining for AChE show regional boundaries: solid lines for outside boundaries and dashed lines for inside boundaries. The cerebellum (Cb) is lateral to the cochlear nucleus. The X symbol in (a) indicates a tissue fold. In (a) and (b) and their tracings, outlined arrow points to the location of the centrifugal labyrinthine bundle, which includes the olivocochlear bundle. The CN in (b) was damaged during processing, and the X symbols indicate position of lost DCN tissue. In (c), the DCN is outlined by dots. Both distances between sections are 150 μm. Abbreviations are identified in Table of Abbreviations. Also, AVCN is labeled by A, PVCN by P, DCN by D, granular region by G, and restiform body by R. Scale bar in (c) represents 3 mm for (A), (B) and (C), and 1.5 mm for (a), (b) and (c). Top is dorsal for all.
