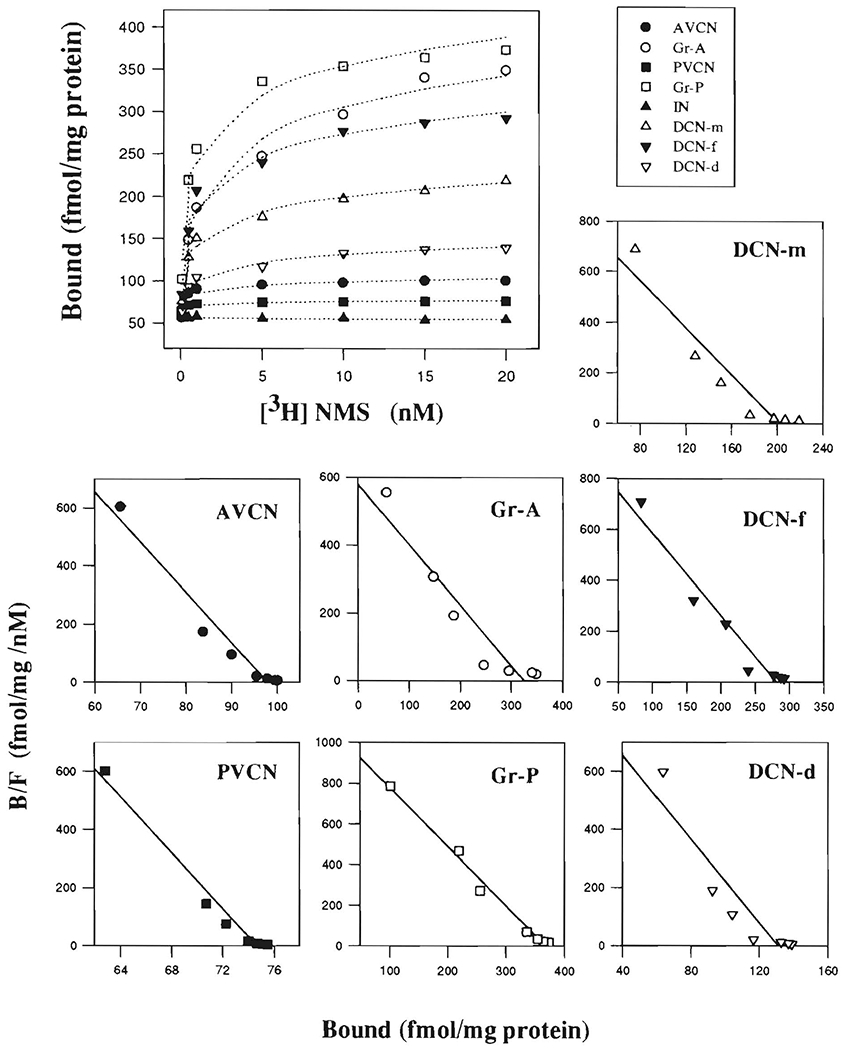
FIGURE 2. Autoradiographic determination of saturating [3H]NMS binding to rat CN subregions.

Saturation curves are displayed in the large figure (top). Individual Rosenthall plots for subregions are displayed in the small figures to illustrate determination of Kd (−1/slope) and Bmax. (x intercept) of NMS binding to them. Rosenthall plot is not shown for IN since measured density of NMS binding there was not significantly different from background. B/F indicates ratio of bound to free ligand concentrions. Abbreviations are identified in Table of Abbreviations.
