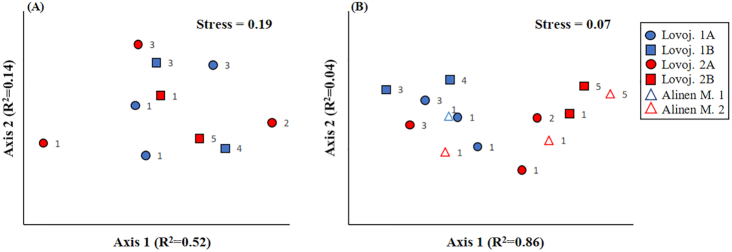
Figure 4.
Results of two-dimensional non-metric multidimensional scaling analysis on genetic differences between MAGs of Methylococcales based on (A) Bray-Curtis distance matrix on the presence/absence data of genes coding for microaerobic and anaerobic metabolism (see information on the genes in Materials and Methods and in Fig. S8A) in MAGs of Lake Lovojärvi and (B) Euclidean distance matrix on relative abundance of genes in different clusters of orthologous group (COG) categories (see the category list in Fig. S8B) in MAGs of Lake Lovojärvi and previously studied Lake Alinen Mustajärvi (see Rissanen et al. 2018). The MAGs are sorted according to their vertical distribution patterns into two major groups (1 and 2), which are both sorted into two subgroups in Lake Lovojärvi (subgroups 1A, 1B, 2A and 2B). See the text as well as Fig. S5 for further information on the grouping. The number at the right side of each symbol denotes the phylogenomic cluster the MAG belongs to (PhyloPhlAn analysis, Fig. S6). The presence/absence data of genes coding for microaerobic and anaerobic metabolism were also analyzed using Jaccard distance matrix with similar results as in panel A (data not shown).

