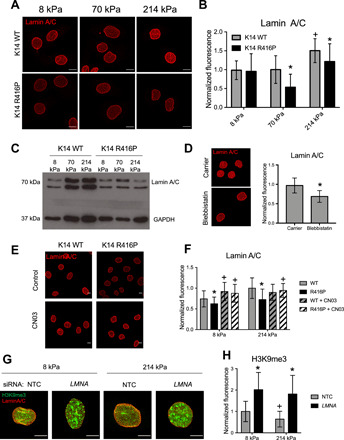
Fig. 5. Impaired K14 stability inhibits nuclear mechanotransduction.

(A) Representative images of lamin A/C in HaCaT keratinocytes expressing K14 WT or K14 R416P cultured on PA gels. Scale bars, 10 μm. (B) Quantification of total lamin A/C fluorescence per cell. Data represent means ± SD for N = 30 to 50 cells from three experiments. *P < 0.05 compared to K14 WT at same stiffness; +P < 0.05 compared to 8 kPa for the same cell type. (C) Western blot analysis of lamin A/C and GAPDH expression in K14 WT and K14 R416P cells cultured on different PA gels. (D) Representative images and quantification of lamin A/C in the parental HaCaT line on 214 kPa gels following treatment with either carrier (0.1% DMSO) or 50 μM blebbistatin for 24 hours. Scale bars, 10 μm. Data represent means ± SD for N = 30 to 40 cells from three experiments. (E) Representative images of lamin A/C in K14 WT and K14 R416P cells on 214-kPa gels treated with Rho-activating peptide CN03 (5 μg/ml) for 24 hours. Scale bars, 10 μm. (F) Quantification of total lamin A/C fluorescence in cells on 8 and 214 kPa gels with or without CN03 treatment. Data represent means ± SD for N = 64 to 103 cells from three experiments. +P < 0.05 compared to untreated for the same gel and cell line; *P < 0.05 compared to WT for the same gel and medium. (G) Representative images of lamin A/C and H3K9me3 fluorescence in HaCaT cells were transfected with nontargeting control (NTC) or LMNA siRNA and cultured on 8 or 214 kPa gels for 24 hours. Scale bars, 5 μm. (H) Quantification of total H3K9me3 fluorescence per cell. Data represent means ± SD for N = 30 cells from three experiments. +P < 0.05 compared to 8 kPa for the same siRNA treatment; *P < 0.05 compared to NTC for the same gel stiffness.
