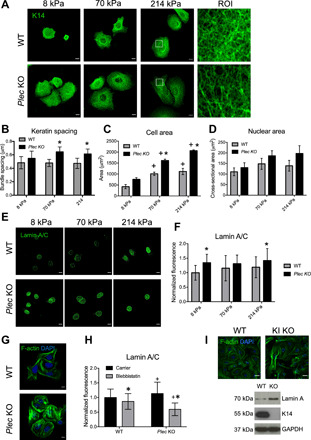
Fig. 6. Plectin deficiency differentially regulates nuclear mechanotransduction.

(A) Representative immunofluorescence images of K14 in WT or Plec KO mouse keratinocytes cultured on PA gels. ROI panels represent the boxed areas in 214 kPa images. Scale bars, 10 μm. (B) Quantification of keratin bundle spacing. Data represent means ± SD for N = 12 to 14 cells from three experiments. *P < 0.05 compared to WT for the same stiffness. (C) Quantification of cell area and (D) nuclear cross-sectional area in WT and Plec KO cells cultured on different PA gels. Data represent means ± SEM for N = 3 experiments. *P < 0.05 compared to WT for the same stiffness; +P < 0.05 compared to 8 kPa for the same cell type. (E) Representative immunofluorescence images of lamin A/C in WT or Plec KO cells cultured on PA gels. Scale bars, 10 μm. (F) Quantification of total lamin A/C fluorescence per cell in WT and Plec KO cells on different PA gels. Data represent means ± SD for N = 30 cells from three experiments. *P < 0.05 compared to WT for the same stiffness. (G) Representative immunofluorescence images of F-actin in WT or Plec KO cells cultured on collagen-coated coverslips. Scale bars, 10 μm. (H) Quantification of total lamin A/C fluorescence in WT and Plec KO cells on collagen-coated coverslips treated with carrier (0.1% DMSO) or 50 μM blebbistatin. Data represent means ± SD for N = 63 to 88 cells from three experiments. +P < 0.05 compared to WT for the same treatment; *P < 0.05 compared to carrier for the same cell type. (I) Immunofluorescence images of F-actin in WT and type I keratin (KI) KO and Western blot analysis of lamin A/C, K14, and GAPDH in WT and KI KO cells. Scale bars, 10 μm.
