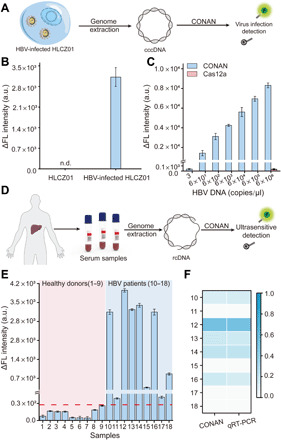
Fig. 4. Evaluation of CONAN for virus infection diagnosis.

(A) Schematic illustration for the analysis of HBV infection in cultured liver cells (HLCZ01) by CONAN. (B) Fluorescence signals of HBV-infected and uninfected HLCZ01 cell samples in CONAN. The concentration of genomic DNA in each tested sample is 6 × 10² copies/μl. n.d., not detected. (C) Fluorescence signals of different amounts of genomic DNA from HBV-infected HLCZ01 in CONAN and the Cas12a gate. (D) Schematic of HBV infection detection in human serum samples by CONAN. (E) The fluorescence signals of 18 serum samples in CONAN. Serum samples from nine healthy donors (1 to 9) and nine patients with chronic hepatitis B (10 to 18) were tested, respectively. (The red dash line indicates the threshold of the highest response of healthy donor plus 3σ). (F) Heatmap of the normalized signal intensities of nine patient samples in CONAN and qRT-PCR. Data represent means ± SD.
