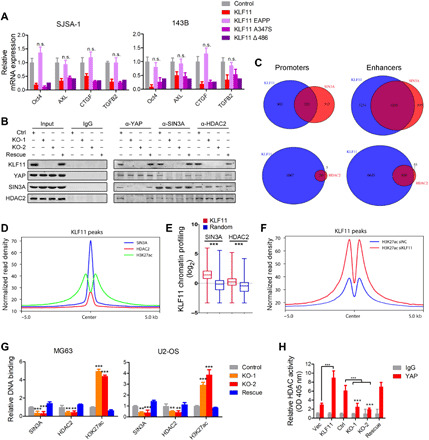
Fig. 4. KLF11 recruits SIN3A/HDAC corepressor to YAP/TEAD complex.

(A) qRT-PCR analysis of indicated stemness genes in osteosarcoma sphere-derived cells (SJSA-1 and 143B) transfected with indicated plasmids after 48 hours (n = 3). n.s., not significant. (B) Co-IP of endogenous YAP and SIN3A/HDAC2 complex in lysates from MG63 cells upon KLF11 deletion and ectopic KLF11 rescue. (C) Venn diagram showing the numbers of promoters and enhancers, respectively, bound by KLF11 and SIN3A (top), KLF11 and HDAC2 (bottom) in MG63 cells. (D) Density profiles of ChIP-seq data showing the occupancy of SIN3A, HDAC2, and H3K27ac in a ±5-kb window surrounding the center of KLF11 peaks. (E) Box plot of the SIN3A and HDAC2 ChIP-seq signal (log2) overlapping with KLF11 bound regions. Data are presented as box-and-whiskers plots (whiskers extend from the 5th to the 95th percentile; the box extends from the 25th to the 75th percentile; the line within the box represents the median). ***P < 10−10 (one-tailed Mann-Whitney U test). (F) Density profiles of ChIP-seq data showing the occupancy of H3K27ac in a ± 5-kb window surrounding the center of KLF11 peaks regions in KLF11-knockdown and control MG63 cells. (G) ChIP assay of the enrichment of SIN3A/HDAC2 and H3K27ac on Oct4 enhancer relative to immunoglobulin G (IgG) in KLF11-deleted and ectopic KLF11 rescue osteosarcoma cells (MG63 and U2-OS) (n = 3). Eluted DNAs were subjected to conventional qPCR. **P < 0.01 and ***P < 0.001. (H) HDAC activity assay of YAP pull-down immunoprecipitates in indicated MG63 cells (n = 3). See also fig. S11. OD, optical density.
