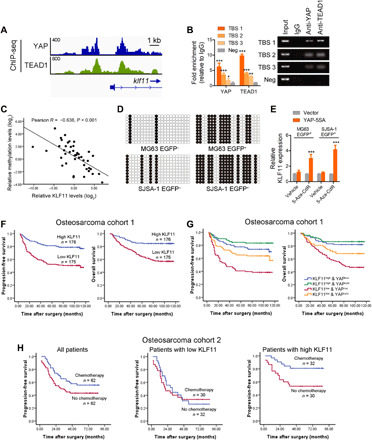
Fig. 5. Hypermethylation-mediated low KLF11 expression predicts poor prognosis and response to chemotherapy.

(A) Genome browser view of ChIP-seq signals at KLF11 promoters as indicated locus in MG63 cells. (B) ChIP assay of the enrichment of YAP and TEAD1 on KLF11 promoter relative to IgG in MG63 cells (n = 3). Eluted DNAs were subjected to conventional qPCR. A random region without TEAD1-binding sites (TBSs) acted as a negative control (Neg). *P < 0.05, **P < 0.01, and ***P < 0.001. (C) The correlation between KLF11 methylation levels and KLF11 expression in human osteosarcoma tissues (n = 42) was analyzed by Pearson’s correlation. (D) Bisulfite sequencing analysis of the methylation status of the KLF11 promoter in eOct4-EGFP+ and eOct4-EGFP− osteosarcoma cells (MG63 and SJSA-1). Open and closed circles indicate the unmethylated and methylated CpG dinucleotides, respectively. (E) qRT-PCR analysis of KLF11 expression in 5-Aza-CdR–treated eOct4-EGFP+ MG63 and SJSA-1 cells transfected with indicated plasmids. ***P < 0.001. (F) Kaplan-Meier analysis of progression-free survival (left; P < 0.001, log-rank test) and overall survival (right; P < 0.001, log-rank test) of patients with osteosarcoma in low (red line) and high (blue line) KLF11 groups from our cohorts. (G) Kaplan-Meier analysis of progression-free survival (P < 0.001) and overall survival (P < 0.001) of patients with osteosarcoma with high or low KLF11 and cytoplasmic or nuclear YAP from our cohorts. (H) Kaplan-Meier analysis of progression-free survival in patients with osteosarcoma with and without doxorubicin-based chemotherapy. Left: All patients (P = 0.059). Middle: Patients with low KLF11 expression (P = 0.771). Right: Patients with high KLF11 expression (P = 0.016). The median KLF11 expression was used as a cutoff. See also figs. S12 to S14 and tables S3 to S6.
