
Fig. 3. UBR7 stabilizes PRPS enzymes through the degradation of PRPSAP.
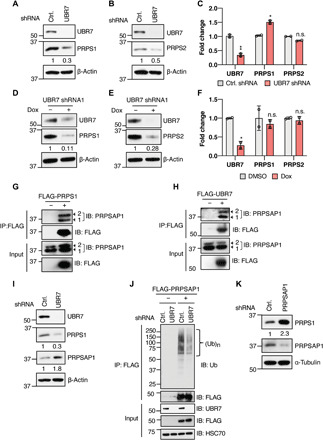
(A and B) Immunoblot showing the PRPS1 (A) and PRPS2 (B) levels in HEK293T cells transduced with control (Ctrl.) or UBR7 shRNA. (C) UBR7, PRPS1, and PRPS2 mRNA fold change in UBR7 knockdown cells normalized to control as measured from qPCR. (D and E) PRPS1 and PRPS2 levels in doxycycline-inducible UBR7 shRNA stable HEK293T cells treated with doxycycline (1 μg/ml) or DMSO for 48 hours. (F) UBR7, PRPS1, and PRPS2 mRNA fold change in doxycycline-inducible UBR7 knockdown cells normalized to control as measured from qPCR. (G and H) Co-IP demonstrating the interaction of FLAG-tagged PRPS1 (G) or UBR7 (H) with endogenous PRPSAP1 in HEK293T cells 1 and 2, represented by arrows, indicate two isoforms of PRPSAP1. (I) PRPS1 and PRPSAP1 levels in control or UBR7 shRNA HEK293T cells. (J) Ubiquitination of transiently transfected vector or FLAG-PRPSAP1 in control or UBR7 shRNA–transduced HEK293T cells treated with 10 μM MG132 for 6 hours before anti-FLAG IP. (K) PRPS1 levels in control or PRPSAP1 shRNA transduced HEK293T cells. Data points in (C) and (F) represent independent biological replicates. Each biological replicate is the mean of at least three technical replicates. Error bars are means ± SD, and P values were computed from Student’s t test and shown with respect to control shRNA (n.s.P > 0.05, *P ≤ 0.05, **P ≤ 0.01). Numbers below the immunoblots represent the relative band intensities.