
Fig. 6. UBR7 knockdown attenuates T-ALL cell proliferation and oncogenic potential.
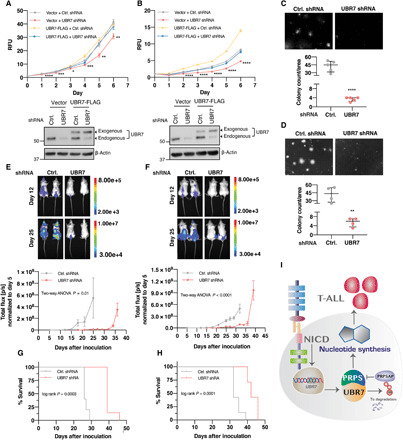
(A and B) Cell proliferation curves of CUTLL1 (A) and Jurkat (B), vector and UBR7-FLAG cells transduced with a constitutive UBR7 shRNA targeting 3′UTR as measured by relative fluorescence unit (RFU) of reduced alamarBlue. Data points represent mean of five technical replicates. Error bars are mean normalized to day 0 ± SD. P values are computed from Student’s t test and shown only with respect to vector + control shRNA (*P ≤ 0.05, **P ≤ 0.01, ***P ≤ 0.001, and ****P ≤ 0.0001). Western blot analysis below the proliferation curve shows the knockdown of endogenous UBR7 and the expression of exogenous UBR7 from the CUTLL1 (A) and Jurkat (B) lysates of day 4. (C and D) Representative images and colony counts from colony formation assay of control or UBR7 shRNA–infected CUTLL1 (C) or Jurkat (D) cells cultured in methylcellulose-based medium for 3 weeks. Data points represent the independent biological replicate. P values are computed from Student’s t test (**P ≤ 0.01, and ****P ≤ 0.0001). (E and F) Representative IVIS images at days 12 and 25 after intravenous transplantation of mice with control or UBR7 shRNA–transduced CUTLL1-luciferase (E) and Jurkat-luciferase cells (F). The plots below represent the tumor progression measured from mean normalized IVIS intensity from all the mice in the group (CUTLL1-luciferase control shRNA, n = 5; CUTLL1-luciferase UBR7 shRNA, n = 7; Jurkat-luciferase control shRNA, n = 7; Jurkat-luciferase UBR7 shRNA, n = 7). (G and H) Mouse survival curves of CUTLL1 (G) or Jurkat (H) control and UBR7 shRNA groups. (I) Model showing the upstream regulation of UBR7 by NOTCH1 signaling and T-ALL promotion through UBR7-PRPS–mediated nucleotide synthesis. PRPSAP1 polyubiquitination–mediated degradation by UBR7 and inhibition of PRPS activity are also depicted.