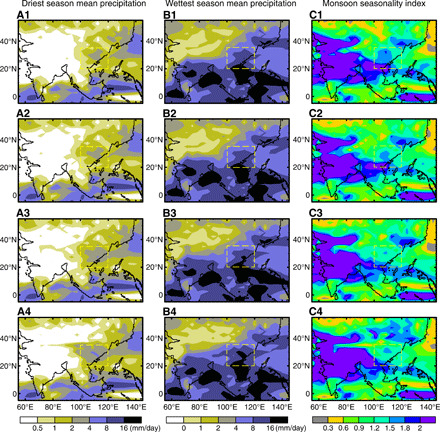
Fig. 3. Simulated precipitation results from selected four experiments with different Tibetan Plateau topographies.

Panels (A1) to (A4), (B1) to (B4), and (C1) to (C4) show driest season (DJF), wettest season (JJA) precipitation, and monsoon seasonality index (see Materials and Methods for the definition) for different experiments, respectively. The yellow color dashed boxes indicate the East Asia region (100°E to 120°E, 20°N to 35°N) discussed in the main text. See Supplementary Text for more details for the selection of four simulations.
