
Fig. 3. Menstrual cycles in relation to the Moon’s synodic cycles.
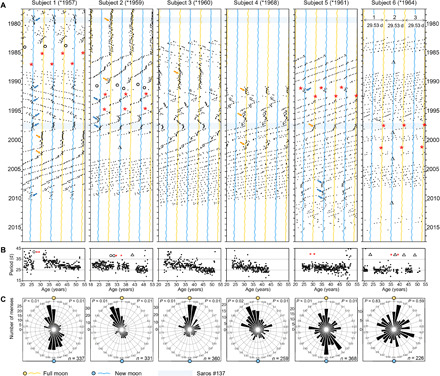
(A) Raster plots of menstrual cycles of six women (birth years in parenthesis) recorded between 1978 and 2015. The raster plots consist of 29.54-day segments of the time series of each individual’s record of menses onsets, which are shown consecutively beneath one another. The segments approximate the 29.53-day period of the synodic month. The plots are repeated three times, as indicated in the plot of subject 6, to facilitate visual inspection of the courses of the menstrual cycles. Onsets of menses are shown as black dots, while times of full moons and new moons are indicated as yellow and blue undulating lines, respectively. Black circles indicate miscarriages; red asterisks indicate births, and triangles indicate gaps in the record. In subjects 1 to 5, the menstrual cycle coupled temporarily to full moons (yellow arrows) or new moons (blue arrows). Light blue shaded areas indicate years of Saros #137, which were characterized by high luminance and high gravitational influence of the Moon during periods when Sun-Earth-Moon syzygies coincided with perigees in which the Moon was exceptionally close to Earth. (B) Periods of menstrual cycles over age. (C) Circular plots of the distribution of menses phases throughout the synodic cycle. The synodic cycle was divided into 30 equal segments each lasting for about 1 day. The number of menses onsets that occurred within a certain segment of the synodic month is plotted radially. Rayleigh tests to check for the presence of a uni- or bimodal distribution with the phases synchronized to the full/new moon (left P values) and for deviations from a uniform frequency distribution of any phase (right P values). Numbers in the lower left corner of each graph indicate the sum of all recorded menses.