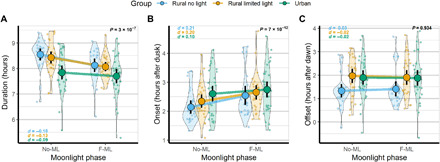
Fig. 3. Analysis of changes in sleep variables according to the No-ML (no moonlight) and F-ML (full moonlight) phases.

(A) Duration of sleep (hours), (B) sleep onset (hours after dusk), and (C) sleep offset (hours after dawn). Smaller dots represent each individual’s mean, while the bigger dots represent the means for each community and are connected by color lines. Vertical black error bars represent the 95% CI of the mean. The reported P values correspond to the main effect of moonlight for the type III analysis of variance (ANOVA); Cohen’s d values are for Tukey contrasts between moonlight phases in each community in the linear mixed-effects models. Only participants with at least four nights recorded in each phase were considered. Number of participants: Ru-NL, 25; Ru-LL, 25; and Ur, 32.
