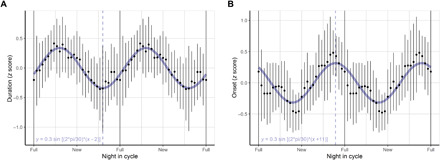
Fig. 4. Association of sleep duration and onset with the moon cycle in a highly urban setting.

Double plots of (A) sleep duration and (B) sleep onset expressed as z scores (±SEM) on weeknights recorded on 463 college students in different quarters from 2015 to 2018. The differences between individual data points and the mean values in each season were calculated for over ~4300 sleep events. The solid lines represent the best fits to sine waves with a 30-day period to the data from nonlinear least squares fits (see Materials and Methods); wave equations are printed at the bottom left. The dashed vertical lines indicate the phase of shorter (A) and later (B) sleep events. Fitted sine wave amplitudes and 95% CI: duration, 0.34 [0.13 to 0.55]; onset, 0.32 [0.10 to 0.53]. The average data summaries were filtered through a moving average with a window of 7 days. Participants/sleep events per quarter: spring, 173/1729; summer, 66/619; fall, 136/1240; and winter, 88/796.
