
Fig. 3. Blockade of CXCL2 and CXCL2 stimulates GBM tumor immunity.
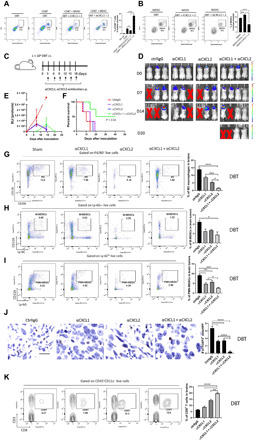
(A and B) A transwell assay was used to determine the extent of migration of CD8+ T cells (A) and MDSCs (B) to tumor cells in the presence or absence of anti-CXCL1 (5 μg/ml) and anti-CXCL2 (5 μg/ml) blocking antibodies. Bar graphs represent the frequency (means ± SEM) of CD8+ T cells (A) or MDSCs (B) in tumors. rCXCL1/2, recombinant CXCL1(2 μg/ml) and CXCL2 proteins (2 μg/ml). (C) This experimental schema was used to test the effects of CXCL1 and CXCL2 blockade in GBM intracranial tumor models. i.p., intraperitoneal; i.c., intracranial. (D) Representative bioluminescence images of FFluc-DBT tumor growth in the DBT orthotopic model. (E) Bioluminescence kinetics of FFluc-DBT tumor growth (three to four mice per group) in the DBT orthotopic models. (F) Survival curves were generated by the Kaplan-Meier method for DBT tumor–bearing mice (three to four mice per group) treated with control IgG or anti-CXCL1/2 antibodies. (G to I and K) DBT tumor–bearing mice were subjected to treatments described in (C). Tumor-bearing mice were euthanized 14 days after inoculation. M2 macrophages (G), MDSCs (H and I), and CD8+ T cell populations (K) in brains were assessed using flow cytometry. Bar graphs represent the frequency (means ± SEM) of the indicated immune cell populations in brains. The results represent three repeated experiments. (J) DBT orthotopic tumor-bearing mice were treated as described in (C). Tumor-bearing mice were euthanized 14 days after inoculation. Tregs were identified using anti-FOXP3 immunohistochemical staining. Scale bar, 50 μm. Bar graphs represent numbers of FOXP3+ cells per high-power field (HPF; means ± SEM). *P < 0.05; **P < 0.01; ***P < 0.001; ****P < 0.0001.