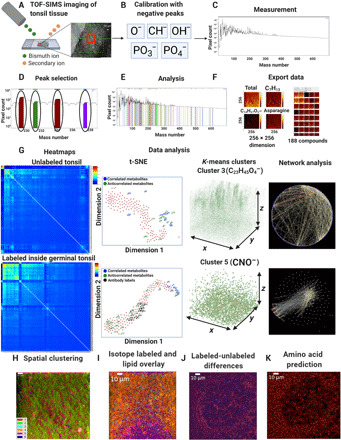
Fig. 1. 3D-SMF.

(A) The schematics of 3D metabolic profiling over 50 to 150 depth layers in a tonsil specimen is illustrated. (B) Calibration of the mass peak lists was performed using the negatively charged ions. (C) Postanalysis of the acquired TOF-SIMS data included extraction of the mass channels, their corresponding intensity counts, and duration of data collection. (D) To determine the exact value of a mass channel, we identified the peaks of the relevant mass channels during the image acquisition or after the measurements. (E) Mass channels were carefully chosen on the basis of the intensity and width of mass channels. (F) The acquired images from the mass channels were analyzed using log transforms and filtering, followed by the data export into an American Standard Code for Information Interchange (ASCII) text. (G) 3D metabolic distributions in the acquired TOF-SIMS datasets were processed by postanalysis methods. (H) The spatial clustering of all TOF-SIMS datasets into six distinct clusters was performed using six unique colors. (I) Overlaid images of isotope-labeled mass channels with those containing distinct 10 lipid fragments were shown. (J) TOF-SIMS signal difference between isotope-labeled and unlabeled dataset of the same GC was illustrated. (K) Prediction of isotope-labeled dataset amino acid mass channel was calculated from mass image differences of labeled and unlabeled channels.
