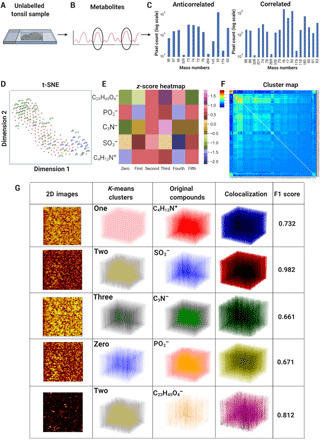
Fig. 2. Anticorrelated and correlated spatially resolved metabolic distributions in tissues.

(A) A 5-μm-thick unlabeled tonsil slice was imaged by a TOF-SIMS device, providing 3D metabolite images over 138 depth slices. (B) The calibration and identification of the 189 mass channels were carried out, and the resultant measurement data were exported into an ASCII text file. (C) The bar graphs for total ion 3D signals were used for the highest 50 correlated and anticorrelated metabolite pairs. (D) The t-SNE plot for the unlabeled tonsil dataset demonstrated the highest (blue) and lowest correlated (anticorrelated) metabolites (green). (E) Six clusters were obtained from a 3D K-means algorithm to visualize selected five metabolites of 50, 63, 74, 79, and 385 m/z (C23H45O4−, cholesterol) on a heatmap of normalized z-scores. (F) Pairwise correlations of the 189 metabolites of the unlabeled tonsil tissue dataset were computed on a clustered heatmap. (G) Five metabolites of 50, 63, 74, 79, and 385 m/z (C23H45O4−, cholesterol) were visualized for six clusters. The first column contains pixel-binned 2D images, the second column shows the 3D clusters, and the third column displays the 3D voxels of the five metabolites. The clusters and the original metabolites were quantified by F1 scores (0.661 to 0.982).
